MetLife 2012 Annual Report Download - page 19
Download and view the complete annual report
Please find page 19 of the 2012 MetLife annual report below. You can navigate through the pages in the report by either clicking on the pages listed below, or by using the keyword search tool below to find specific information within the annual report.-
 1
1 -
2
-
3
-
4
-
5
-
6
-
7
-
8
-
 9
9 -
 10
10 -
 11
11 -
 12
12 -
 13
13 -
 14
14 -
 15
15 -
 16
16 -
 17
17 -
 18
18 -
 19
19 -
 20
20 -
 21
21 -
 22
22 -
 23
23 -
 24
24 -
 25
25 -
 26
26 -
 27
27 -
 28
28 -
 29
29 -
30
-
31
-
32
-
33
-
34
-
35
-
36
-
37
-
38
-
39
-
40
-
41
-
42
-
43
-
44
-
45
-
46
-
47
-
48
-
49
-
50
-
51
-
52
-
53
-
54
-
55
-
56
-
57
-
58
-
59
-
60
-
61
-
62
-
63
-
64
-
65
-
66
-
67
-
68
-
69
-
70
-
71
-
72
-
73
-
74
-
75
-
76
-
77
-
78
-
79
-
80
-
81
-
82
-
83
-
84
-
85
-
86
-
87
-
88
-
89
-
90
-
91
-
92
-
93
-
94
-
95
-
96
-
97
-
98
-
99
-
100
-
101
-
102
-
103
-
104
-
105
-
106
-
107
-
108
-
109
-
110
-
111
-
112
-
113
-
114
-
115
-
116
-
117
-
118
-
119
-
120
-
121
-
122
-
123
-
124
-
125
-
126
-
127
-
128
-
129
-
130
-
131
-
132
-
133
-
134
-
135
-
136
-
137
-
138
-
139
-
140
-
141
-
142
-
143
-
144
-
145
-
146
-
147
-
148
-
149
-
150
-
151
-
152
-
153
-
154
-
155
-
156
-
157
-
158
-
159
-
160
-
161
-
162
-
163
-
164
-
165
-
166
-
167
-
168
-
169
-
170
-
171
-
172
-
173
-
174
-
175
-
176
-
177
-
178
-
179
-
180
-
181
-
182
-
183
-
184
-
185
-
186
-
187
-
188
-
189
-
190
-
191
-
192
-
193
-
194
-
195
-
196
-
197
-
198
-
199
-
200
-
201
-
202
-
203
-
204
-
205
-
206
-
207
-
208
-
209
-
210
-
211
-
212
-
213
-
214
-
215
 |
 |

Reinsurance
Accounting for reinsurance requires extensive use of assumptions and estimates, particularly related to the future performance of the underlying
business and the potential impact of counterparty credit risks. We periodically review actual and anticipated experience compared to the
aforementioned assumptions used to establish assets and liabilities relating to ceded and assumed reinsurance and evaluate the financial strength of
counterparties to our reinsurance agreements using criteria similar to that evaluated in the security impairment process discussed subsequently.
Additionally, for each of our reinsurance agreements, we determine whether the agreement provides indemnification against loss or liability relating to
insurance risk, in accordance with applicable accounting standards. We review all contractual features, particularly those that may limit the amount of
insurance risk to which the reinsurer is subject or features that delay the timely reimbursement of claims. If we determine that a reinsurance agreement
does not expose the reinsurer to a reasonable possibility of a significant loss from insurance risk, we record the agreement using the deposit method of
accounting.
See Note 6 of the Notes to the Consolidated Financial Statements for additional information on our reinsurance programs.
Deferred Policy Acquisition Costs and Value of Business Acquired
We incur significant costs in connection with acquiring new and renewal insurance business. Costs that relate directly to the successful acquisition
or renewal of insurance contracts are deferred as DAC. In addition to commissions, certain direct-response advertising expenses and other direct costs,
deferrable costs include the portion of an employee’s total compensation and benefits related to time spent selling, underwriting or processing the
issuance of new and renewal insurance business only with respect to actual policies acquired or renewed. We utilize various techniques to estimate the
portion of an employee’s time spent on qualifying acquisition activities that result in actual sales, including surveys, interviews, representative time
studies and other methods. These estimates include assumptions that are reviewed and updated on a periodic basis or more frequently to reflect
significant changes in processes or distribution methods.
VOBA represents the excess of book value over the estimated fair value of acquired insurance, annuity, and investment-type contracts in-force at
the acquisition date. For certain acquired blocks of business, the estimated fair value of the in-force contract obligations exceeded the book value of
assumed in-force insurance policy liabilities, resulting in negative VOBA, which is presented separately from VOBA as an additional insurance liability
included in other policy-related balances. The estimated fair value of the acquired liabilities is based on projections, by each block of business, of future
policy and contract charges, premiums, mortality and morbidity, separate account performance, surrenders, operating expenses, investment returns,
nonperformance risk adjustment and other factors. Actual experience on the purchased business may vary from these projections. The recovery of DAC
and VOBA is dependent upon the future profitability of the related business.
Separate account rates of return on variable universal life contracts and variable deferred annuity contracts affect in-force account balances on such
contracts each reporting period, which can result in significant fluctuations in amortization of DAC and VOBA. Our practice to determine the impact of
gross profits resulting from returns on separate accounts assumes that long-term appreciation in equity markets is not changed by short-term market
fluctuations, but is only changed when sustained interim deviations are expected. We monitor these events and only change the assumption when our
long-term expectation changes. The effect of an increase (decrease) by 100 basis points in the assumed future rate of return is reasonably likely to
result in a decrease (increase) in the DAC and VOBA amortization of approximately $180 million, with an offset to our unearned revenue liability of
approximately $30 million for this factor. We use a mean reversion approach to separate account returns where the mean reversion period is five years
with a long-term separate account return after the five-year reversion period is over. The current long-term rate of return assumption for the variable
universal life contracts and variable deferred annuity contracts is 7.25% for the U.S.
We also periodically review other long-term assumptions underlying the projections of estimated gross margins and profits. These assumptions
primarily relate to investment returns, policyholder dividend scales, interest crediting rates, mortality, persistency, and expenses to administer business.
Assumptions used in the calculation of estimated gross margins and profits which may have significantly changed are updated annually. If the update of
assumptions causes expected future gross margins and profits to increase, DAC and VOBA amortization will decrease, resulting in a current period
increase to earnings. The opposite result occurs when the assumption update causes expected future gross margins and profits to decrease.
Our most significant assumption updates resulting in a change to expected future gross margins and profits and the amortization of DAC and VOBA
are due to revisions to expected future investment returns, expenses, in-force or persistency assumptions and policyholder dividends on participating
traditional life contracts, variable and universal life contracts and annuity contracts. We expect these assumptions to be the ones most reasonably likely
to cause significant changes in the future. Changes in these assumptions can be offsetting and we are unable to predict their movement or offsetting
impact over time.
At December 31, 2012, 2011 and 2010, DAC and VOBA for the Company was $24.8 billion, $24.6 billion and $24.5 billion, respectively.
Amortization of DAC and VOBA associated with the variable and universal life and the annuity contracts was significantly impacted by movements in
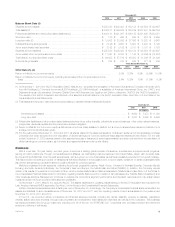
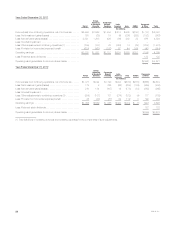
equity markets. The following illustrates the effect on DAC and VOBA of changing each of the respective assumptions, as well as updating estimated
gross margins or profits with actual gross margins or profits during the years ended December 31, 2012, 2011 and 2010. Increases (decreases) in
DAC and VOBA balances, as presented below, resulted in a corresponding decrease (increase) in amortization.
Years Ended December 31,
2012 2011 2010
(In millions)
Investment return .................................................................. $(161) $ (43) $ (71)
Separate account balances .......................................................... 39 (125) 49
Net investment gain (loss) ........................................................... (44) (530) (109)
Guaranteed minimum income benefits ................................................. 23 (13) 76
Expense ......................................................................... 10 (6) 81
In-force/Persistency ................................................................ 368 (6) (29)
Policyholder dividends and other ...................................................... (4) 32 (159)
Total .......................................................................... $ 231 $(691) $(162)
MetLife, Inc. 13