MetLife 2012 Annual Report Download - page 109
Download and view the complete annual report
Please find page 109 of the 2012 MetLife annual report below. You can navigate through the pages in the report by either clicking on the pages listed below, or by using the keyword search tool below to find specific information within the annual report.-
 1
1 -
2
-
3
-
4
-
5
-
6
-
7
-
8
-
9
-
10
-
11
-
12
-
13
-
14
-
15
-
16
-
17
-
18
-
19
-
20
-
21
-
22
-
23
-
24
-
25
-
26
-
27
-
28
-
29
-
30
-
31
-
32
-
33
-
34
-
35
-
36
-
37
-
38
-
39
-
40
-
41
-
42
-
43
-
44
-
45
-
46
-
47
-
48
-
49
-
50
-
51
-
52
-
53
-
54
-
55
-
56
-
57
-
58
-
59
-
60
-
61
-
62
-
63
-
64
-
65
-
66
-
67
-
68
-
69
-
70
-
71
-
72
-
73
-
74
-
75
-
76
-
77
-
78
-
79
-
80
-
81
-
82
-
83
-
84
-
85
-
86
-
87
-
88
-
89
-
90
-
91
-
92
-
93
-
94
-
95
-
96
-
97
-
98
-
 99
99 -
 100
100 -
 101
101 -
 102
102 -
 103
103 -
 104
104 -
 105
105 -
 106
106 -
 107
107 -
 108
108 -
 109
109 -
 110
110 -
 111
111 -
 112
112 -
 113
113 -
 114
114 -
 115
115 -
 116
116 -
 117
117 -
 118
118 -
 119
119 -
120
-
121
-
122
-
123
-
124
-
125
-
126
-
127
-
128
-
129
-
130
-
131
-
132
-
133
-
134
-
135
-
136
-
137
-
138
-
139
-
140
-
141
-
142
-
143
-
144
-
145
-
146
-
147
-
148
-
149
-
150
-
151
-
152
-
153
-
154
-
155
-
156
-
157
-
158
-
159
-
160
-
161
-
162
-
163
-
164
-
165
-
166
-
167
-
168
-
169
-
170
-
171
-
172
-
173
-
174
-
175
-
176
-
177
-
178
-
179
-
180
-
181
-
182
-
183
-
184
-
185
-
186
-
187
-
188
-
189
-
190
-
191
-
192
-
193
-
194
-
195
-
196
-
197
-
198
-
199
-
200
-
201
-
202
-
203
-
204
-
205
-
206
-
207
-
208
-
209
-
210
-
211
-
212
-
213
-
214
-
215
 |
 |

MetLife, Inc.
Notes to the Consolidated Financial Statements — (Continued)
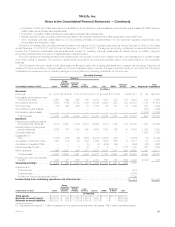
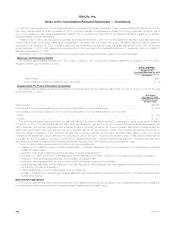
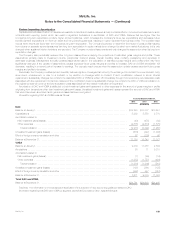
Years ended December 31,
2012 2011 2010
(In millions)
Total revenues .................................................................................. $74 $484 $464
Total expenses ................................................................................. — 363 406
Income (loss) before provision for income tax .......................................................... 74 121 58
Provision for income tax expense (benefit) ............................................................ 26 33 20
Income (loss) from operations of discontinued operations, net of income tax .................................. 48 88 38
Gain (loss) on disposal of operations, net of income tax .................................................. — (64) 6
Income (loss) from discontinued operations, net of income tax ............................................ $48 $ 24 $ 44
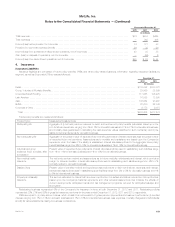
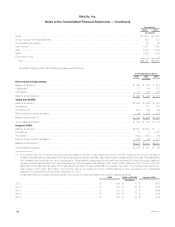
4. Insurance
Insurance Liabilities
Insurance liabilities are comprised of future policy benefits, PABs and other policy-related balances. Information regarding insurance liabilities by
segment, as well as Corporate & Other, was as follows at:
December 31,
2012 2011
(In millions)
Retail ............................................................................................... $138,082 $138,872
Group, Voluntary & Worksite Benefits ...................................................................... 29,996 28,899
Corporate Benefit Funding .............................................................................. 117,065 106,225
Latin America ........................................................................................ 16,055 13,890
Asia ................................................................................................ 103,064 98,267
EMEA .............................................................................................. 20,200 22,348
Corporate & Other .................................................................................... 9,173 9,073
Total ............................................................................................. $433,635 $417,574
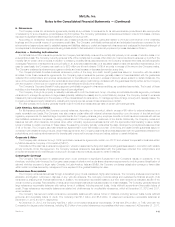
Future policy benefits are measured as follows:
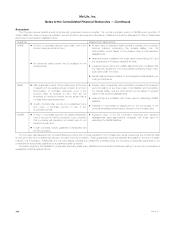
Product Type: Measurement Assumptions:
Participating life Aggregate of (i) net level premium reserves for death and endowment policy benefits (calculated based upon the
non-forfeiture interest rate, ranging from 3% to 7% for domestic business and 1% to 21% for international business,
and mortality rates guaranteed in calculating the cash surrender values described in such contracts); and (ii) the
liability for terminal dividends for domestic business.
Non-participating life Aggregate of the present value of expected future benefit payments and related expenses less the present value
of expected future net premiums. Assumptions as to mortality and persistency are based upon the Company’s
experience when the basis of the liability is established. Interest rate assumptions for the aggregate future policy
benefit liabilities range from 2% to 10% for domestic business and 1% to 16% for international business.
Individual and group
traditional fixed annuities after
annuitization
Present value of expected future payments. Interest rate assumptions used in establishing such liabilities range
from 1% to 11% for domestic business and 1% to 13% for international business.
Non-medical health
insurance
The net level premium method and assumptions as to future morbidity, withdrawals and interest, which provide a
margin for adverse deviation. Interest rate assumptions used in establishing such liabilities range from 4% to 7%
(primarily related to domestic business).
Disabled lives Present value of benefits method and experience assumptions as to claim terminations, expenses and interest.
Interest rate assumptions used in establishing such liabilities range from 2% to 8% for domestic business and 1%
to 9% for international business.
Property and casualty
insurance
The amount estimated for claims that have been reported but not settled and claims incurred but not reported are
based upon the Company’s historical experience and other actuarial assumptions that consider the effects of
current developments, anticipated trends and risk management programs, reduced for anticipated salvage and
subrogation.
Participating business represented 6% of the Company’s life insurance in-force at both December 31, 2012 and 2011. Participating policies
represented 20%, 21% and 26% of gross life insurance premiums for the years ended December 31, 2012, 2011 and 2010, respectively.
PABs are equal to: (i) policy account values, which consist of an accumulation of gross premium payments and investment performance; (ii) credited
interest, ranging from 1% to 13% for domestic business and 1% to 16% for international business, less expenses, mortality charges and withdrawals;
and (iii) fair value adjustments relating to business combinations.
MetLife, Inc. 103