MetLife 2012 Annual Report Download - page 31
Download and view the complete annual report
Please find page 31 of the 2012 MetLife annual report below. You can navigate through the pages in the report by either clicking on the pages listed below, or by using the keyword search tool below to find specific information within the annual report.-
 1
1 -
2
-
3
-
4
-
5
-
6
-
7
-
8
-
9
-
10
-
11
-
12
-
13
-
14
-
15
-
16
-
17
-
18
-
19
-
20
-
 21
21 -
 22
22 -
 23
23 -
 24
24 -
 25
25 -
 26
26 -
 27
27 -
 28
28 -
 29
29 -
 30
30 -
 31
31 -
 32
32 -
 33
33 -
 34
34 -
 35
35 -
 36
36 -
 37
37 -
 38
38 -
 39
39 -
 40
40 -
 41
41 -
42
-
43
-
44
-
45
-
46
-
47
-
48
-
49
-
50
-
51
-
52
-
53
-
54
-
55
-
56
-
57
-
58
-
59
-
60
-
61
-
62
-
63
-
64
-
65
-
66
-
67
-
68
-
69
-
70
-
71
-
72
-
73
-
74
-
75
-
76
-
77
-
78
-
79
-
80
-
81
-
82
-
83
-
84
-
85
-
86
-
87
-
88
-
89
-
90
-
91
-
92
-
93
-
94
-
95
-
96
-
97
-
98
-
99
-
100
-
101
-
102
-
103
-
104
-
105
-
106
-
107
-
108
-
109
-
110
-
111
-
112
-
113
-
114
-
115
-
116
-
117
-
118
-
119
-
120
-
121
-
122
-
123
-
124
-
125
-
126
-
127
-
128
-
129
-
130
-
131
-
132
-
133
-
134
-
135
-
136
-
137
-
138
-
139
-
140
-
141
-
142
-
143
-
144
-
145
-
146
-
147
-
148
-
149
-
150
-
151
-
152
-
153
-
154
-
155
-
156
-
157
-
158
-
159
-
160
-
161
-
162
-
163
-
164
-
165
-
166
-
167
-
168
-
169
-
170
-
171
-
172
-
173
-
174
-
175
-
176
-
177
-
178
-
179
-
180
-
181
-
182
-
183
-
184
-
185
-
186
-
187
-
188
-
189
-
190
-
191
-
192
-
193
-
194
-
195
-
196
-
197
-
198
-
199
-
200
-
201
-
202
-
203
-
204
-
205
-
206
-
207
-
208
-
209
-
210
-
211
-
212
-
213
-
214
-
215
 |
 |

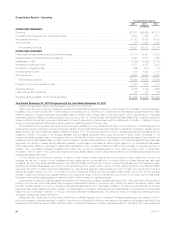
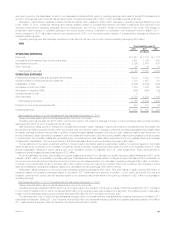
tsunami in Japan. The current period included $103 million of employee–related and other costs associated with the Company’s enterprise-wide
strategic initiative and a $50 million impairment charge on an intangible asset related to a previously acquired dental business.
The Company benefited from the impact of certain permanent tax differences, including non-taxable investment income and tax credits for
investments in low income housing. As a result, our effective tax rates differ from the U.S. statutory rate of 35%. In 2012, we benefited primarily from
higher utilization of tax preferenced investments, which improved operating earnings by $65 million over the prior year.
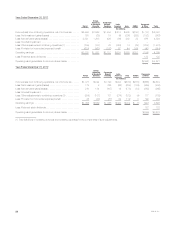
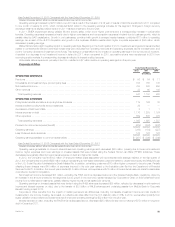
Year Ended December 31, 2011 Compared with the Year Ended December 31, 2010
Unless otherwise stated, all amounts discussed below are net of income tax.
The increase in operating earnings reflects the impact of the ALICO Acquisition with the corresponding effects on each of our financial statement
lines in Latin America, Asia and EMEA. Further trends and matters impacting our business and the comparison to 2010 results are discussed below.
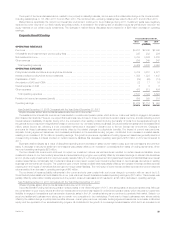
Positive results from strong sales in 2011 were offset by losses from severe weather and the impact of the low interest rate environment. Changes in
foreign currency exchange rates had a slightly positive impact on results compared to 2010.
In 2011, we benefited from strong sales as well as growth and higher persistency in our business, across many of our products. As a result, we
experienced growth in our investment portfolio, as well as our average separate account assets, generating both higher net investment income of $565
million and higher policy fee income of $373 million. Since many of our products are interest spread-based, the growth in our individual life, LTC and
structured settlement businesses also resulted in a $108 million increase in interest credited expenses. These increased sales also generated an
increase in commission and other volume-related expenses of $568 million, which was largely offset by an increase of $476 million in related DAC
capitalization. DAC amortization also increased $79 million. In addition, other non-variable expenses increased $81 million due to growth in our existing
businesses.
We review and update our long-term assumptions used in our calculations of certain insurance-related liabilities and DAC annually, which may result
in changes and are recorded in the fourth quarter each year. This annual update, along with other reserve refinements, contributed to a net operating
earnings increase of $59 million, mainly in the universal life block of business. In addition, to better align with hedged risks, certain elements of our
variable annuity hedging program that were previously recorded in net investment income were recorded in net derivative gains (losses) beginning in
2011 which resulted in a decrease in operating earnings of $77 million.
In the fourth quarter of 2011, we announced a reduction in our dividend scale related to our closed block. The impact of this action increased
operating earnings by $54 million.
Severe weather during 2011 was the primary driver of our unfavorable claims experience in our property & casualty business, which decreased
operating earnings by $239 million. In addition, in the third quarter of 2011, we incurred a $117 million charge to increase reserves in connection with
our use of the U.S. Social Security Administration’s Death Master File, impacting primarily Group, Voluntary & Worksite Benefits. These events
overshadowed positive results of $76 million, driven by favorable claims experience in our dental and disability businesses and strong mortality gains in
our group life business.
Market factors, specifically the current low interest rate environment, continued to be a challenge during 2011. Also in 2011, equity markets
remained relatively flat compared to much stronger 2010 equity market performance. Excluding the impact of Divested Businesses, investment yields
were negatively impacted by the current low interest rate environment and lower returns in the equity markets, partially offset by improving real estate
markets, resulting in a $322 million decrease in net investment income. Partially offsetting this decrease was a $134 million improvement in operating
earnings, primarily driven by lower average crediting rates on our annuity and funding agreement businesses. The lower average crediting rates continue
to reflect the lower investment returns available in the marketplace. Also contributing to the decrease in interest credited is the impact from derivatives
that are used to hedge certain liabilities in our funding agreement business.
Interest expense on debt increased $81 million primarily as a result of debt issued in the third and fourth quarters of 2010 in connection with the
ALICO Acquisition.
The Company incurred $40 million of expenses related to a liquidation plan filed by the Department of Financial Services for ELNY in the third quarter
of 2011.
The Company also benefited from higher tax credits in 2011 of $84 million over 2010 primarily due to $75 million of charges in 2010 related to the
Patient Protection and Affordable Care Act and the Health Care and Education Reconciliation Act of 2010 (together, the “Health Care Act”). The Health
Care Act reduced the tax deductibility of retiree health care costs to the extent of any Medicare Part D subsidy received beginning in 2013. Because the
deductibility of future retiree health care costs was reflected in our financial statements, the entire future impact of this change in law was required to be
recorded as a charge in the first quarter of 2010, when the legislation was enacted. The Company benefits from the impact of certain permanent tax
differences, including non-taxable investment income and tax credits for investments in low income housing. As a result, our effective tax rates differ
from the U.S. statutory rate of 35%. In 2011, we benefited primarily from higher utilization of tax preferenced investments, which improved operating
earnings by $9 million over the prior period.
MetLife, Inc. 25