MetLife 2012 Annual Report Download - page 36
Download and view the complete annual report
Please find page 36 of the 2012 MetLife annual report below. You can navigate through the pages in the report by either clicking on the pages listed below, or by using the keyword search tool below to find specific information within the annual report.-
 1
1 -
2
-
3
-
4
-
5
-
6
-
7
-
8
-
9
-
10
-
11
-
12
-
13
-
14
-
15
-
16
-
17
-
18
-
19
-
20
-
21
-
22
-
23
-
24
-
25
-
 26
26 -
 27
27 -
 28
28 -
 29
29 -
 30
30 -
 31
31 -
 32
32 -
 33
33 -
 34
34 -
 35
35 -
 36
36 -
 37
37 -
 38
38 -
 39
39 -
 40
40 -
 41
41 -
 42
42 -
 43
43 -
 44
44 -
 45
45 -
 46
46 -
47
-
48
-
49
-
50
-
51
-
52
-
53
-
54
-
55
-
56
-
57
-
58
-
59
-
60
-
61
-
62
-
63
-
64
-
65
-
66
-
67
-
68
-
69
-
70
-
71
-
72
-
73
-
74
-
75
-
76
-
77
-
78
-
79
-
80
-
81
-
82
-
83
-
84
-
85
-
86
-
87
-
88
-
89
-
90
-
91
-
92
-
93
-
94
-
95
-
96
-
97
-
98
-
99
-
100
-
101
-
102
-
103
-
104
-
105
-
106
-
107
-
108
-
109
-
110
-
111
-
112
-
113
-
114
-
115
-
116
-
117
-
118
-
119
-
120
-
121
-
122
-
123
-
124
-
125
-
126
-
127
-
128
-
129
-
130
-
131
-
132
-
133
-
134
-
135
-
136
-
137
-
138
-
139
-
140
-
141
-
142
-
143
-
144
-
145
-
146
-
147
-
148
-
149
-
150
-
151
-
152
-
153
-
154
-
155
-
156
-
157
-
158
-
159
-
160
-
161
-
162
-
163
-
164
-
165
-
166
-
167
-
168
-
169
-
170
-
171
-
172
-
173
-
174
-
175
-
176
-
177
-
178
-
179
-
180
-
181
-
182
-
183
-
184
-
185
-
186
-
187
-
188
-
189
-
190
-
191
-
192
-
193
-
194
-
195
-
196
-
197
-
198
-
199
-
200
-
201
-
202
-
203
-
204
-
205
-
206
-
207
-
208
-
209
-
210
-
211
-
212
-
213
-
214
-
215
 |
 |

investment income. This growth in premiums, deposits and funding agreement issuances also increased the interest credited on future policyholder
liabilities and policyholder account balances. The net result of these increases contributed $114 million to operating earnings.
Market factors, including the current low interest rate environment, have negatively impacted our investment returns. However, the low interest rate
environment also decreased interest credited to policyholders and the interest credited expense associated with insurance liabilities. Many of our
funding agreement and guaranteed interest contract liabilities are tied to market indices. Interest rates on new business were set lower, as were the
rates on existing business with terms that can fluctuate. The lower investment returns were more than offset by the decrease in interest credited
expense, resulting in an increase in operating earnings of $75 million. The lower investment returns also includes the impact of returns on invested
economic capital, and the decrease in interest credited is impacted by derivatives that are used to hedge certain liabilities in our funding agreement
business.
The Company’s use of the U.S. Social Security Administration’s Death Master File in connection with our post-retirement benefit business resulted in
a charge in the third quarter of the current year of $8 million. Other insurance liability refinements and mortality results negatively impacted our year-over-
year operating earnings by $34 million.
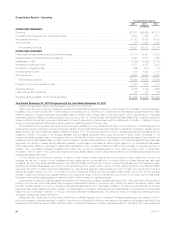
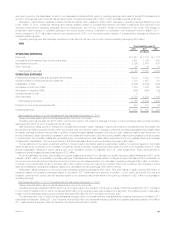
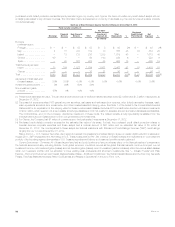
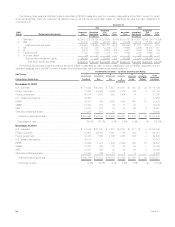
Latin America
Years Ended December 31,
2012 2011 2010
(In millions)
OPERATING REVENUES
Premiums ....................................................................................... $2,578 $2,514 $1,969
Universal life and investment-type product policy fees ..................................................... 785 757 630
Net investment income ............................................................................. 1,198 1,025 927
Other revenues ................................................................................... 16 15 12
Total operating revenues .......................................................................... 4,577 4,311 3,538
OPERATING EXPENSES
Policyholder benefits and claims and policyholder dividends ................................................ 2,231 2,064 1,829
Interest credited to policyholder account balances ........................................................ 393 371 370
Capitalization of DAC .............................................................................. (353) (295) (221)
Amortization of DAC and VOBA ...................................................................... 224 207 144
Amortization of negative VOBA ....................................................................... (5) (6) (1)
Interest expense on debt ........................................................................... (1) 1 1
Other expenses .................................................................................. 1,375 1,305 901
Total operating expenses ......................................................................... 3,864 3,647 3,023
Provision for income tax expense (benefit) .............................................................. 130 150 92
Operating earnings ................................................................................ $ 583 $ 514 $ 423
Year Ended December 31, 2012 Compared with the Year Ended December 31, 2011
Unless otherwise stated, all amounts discussed below are net of income tax.
Operating earnings increased by $69 million over the prior year. The impact of changes in foreign currency exchange rates reduced operating
earnings by $30 million for 2012 compared to 2011.
Latin America experienced strong sales growth primarily driven by retirement products in Mexico, Chile and Brazil and by accident and health
products in Argentina and Chile. Changes in premiums for these products were almost entirely offset by the related changes in policyholder benefits and
unfavorable claims experience. The growth in our businesses drove an increase in average invested assets, which generated higher net investment
income and higher policy fee income, partially offset by an increase in interest credited to policyholders. The increase in sales also generated higher
commission expense, which was partially offset by a corresponding increase in DAC capitalization. The items discussed above, coupled with a change
in allocated equity, were the primary drivers of a $41 million improvement in operating earnings.
Market factors increased operating earnings by $15 million. An increase in investment yields primarily reflects higher returns on fixed maturities from a
repositioning of the portfolio in Argentina and higher returns on variable rate investments in Brazil, partially offset by a corresponding increase in interest
credited expense. A decrease in net investment income from lower inflation in the prior year was substantially offset by a corresponding decrease in
policyholder benefits.
Current year results include various favorable income tax items of $38 million in Argentina, Mexico and Chile. In addition, the current year results
benefited from liability refinements of $22 million in Chile and Mexico which were partially offset by an unfavorable DAC capitalization adjustment in Chile
and a write-off of capitalized software in Mexico.
Year Ended December 31, 2011 Compared with the Year Ended December 31, 2010
Unless otherwise stated, all amounts discussed below are net of income tax.
Operating earnings increased by $91 million over 2010 primarily as a result of the inclusion of a full year of results of ALICO’s operations for 2011
compared to one month of results for 2010, which contributed $36 million to the operating earnings increase for the segment. The positive impact of
changes in foreign currency exchange rates improved reported earnings by $15 million for 2011 compared to the prior year.
Latin America experienced strong sales growth driven primarily by accident & health products. In addition, sales of retirement products in Mexico as
well as immediate annuity products in Chile increased over the prior year. Net investment income increased due to increased average invested assets
and higher fee income on universal life products, primarily in Mexico, also favorably impacted operating earnings. Commissions and compensation
expenses were higher in Mexico and Brazil due to business growth, which is offset by DAC capitalization. Other expenses also increased over the prior
30 MetLife, Inc.