MetLife 2012 Annual Report Download - page 33
Download and view the complete annual report
Please find page 33 of the 2012 MetLife annual report below. You can navigate through the pages in the report by either clicking on the pages listed below, or by using the keyword search tool below to find specific information within the annual report.-
 1
1 -
2
-
3
-
4
-
5
-
6
-
7
-
8
-
9
-
10
-
11
-
12
-
13
-
14
-
15
-
16
-
17
-
18
-
19
-
20
-
21
-
22
-
 23
23 -
 24
24 -
 25
25 -
 26
26 -
 27
27 -
 28
28 -
 29
29 -
 30
30 -
 31
31 -
 32
32 -
 33
33 -
 34
34 -
 35
35 -
 36
36 -
 37
37 -
 38
38 -
 39
39 -
 40
40 -
 41
41 -
 42
42 -
 43
43 -
44
-
45
-
46
-
47
-
48
-
49
-
50
-
51
-
52
-
53
-
54
-
55
-
56
-
57
-
58
-
59
-
60
-
61
-
62
-
63
-
64
-
65
-
66
-
67
-
68
-
69
-
70
-
71
-
72
-
73
-
74
-
75
-
76
-
77
-
78
-
79
-
80
-
81
-
82
-
83
-
84
-
85
-
86
-
87
-
88
-
89
-
90
-
91
-
92
-
93
-
94
-
95
-
96
-
97
-
98
-
99
-
100
-
101
-
102
-
103
-
104
-
105
-
106
-
107
-
108
-
109
-
110
-
111
-
112
-
113
-
114
-
115
-
116
-
117
-
118
-
119
-
120
-
121
-
122
-
123
-
124
-
125
-
126
-
127
-
128
-
129
-
130
-
131
-
132
-
133
-
134
-
135
-
136
-
137
-
138
-
139
-
140
-
141
-
142
-
143
-
144
-
145
-
146
-
147
-
148
-
149
-
150
-
151
-
152
-
153
-
154
-
155
-
156
-
157
-
158
-
159
-
160
-
161
-
162
-
163
-
164
-
165
-
166
-
167
-
168
-
169
-
170
-
171
-
172
-
173
-
174
-
175
-
176
-
177
-
178
-
179
-
180
-
181
-
182
-
183
-
184
-
185
-
186
-
187
-
188
-
189
-
190
-
191
-
192
-
193
-
194
-
195
-
196
-
197
-
198
-
199
-
200
-
201
-
202
-
203
-
204
-
205
-
206
-
207
-
208
-
209
-
210
-
211
-
212
-
213
-
214
-
215
 |
 |

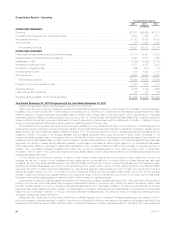
Year Ended December 31, 2011 Compared with the Year Ended December 31, 2010
Unless otherwise stated, all amounts discussed below are net of income tax.
In 2011, operating results for our property & casualty business were negatively impacted by severe weather, including a record number of tornadoes
in the second quarter and Hurricane Irene in the third quarter. Overall sales increased, largely driven by a 51% increase in annuity sales, which grew to
$30.4 billion, mainly from strong growth in variable annuities across all distribution channels. However, the favorable impact of our sales growth was
dampened by the sustained low interest rate environment. Variable annuity product sales increased primarily due to the introduction of a new higher
benefit, lower-risk variable annuity rider and changes in competitors’ offerings which, we believe, made our products more attractive. We launched
several changes to our annuity products and riders that are expected to reduce sales volumes in 2012, as we manage sales to strike the right balance
among growth, profitability and risk. Retail life and annuity net flows were $18.6 billion, $8.7 billion higher than 2010.
Sales growth in variable annuities and in our variable and universal life products, along with higher persistency in 2011, resulted in an increase in
operating earnings of $295 million. The growth in variable products increased average separate account assets and, as a result, generated higher
asset-based fee revenue on the separate account assets, partially offset by increases in DAC amortization. This, coupled with the impact of positive net
flows on invested assets, increased net investment income. Partially offsetting the positive impact from the strong sales of variable annuities, were
increases in variable expenses, net of DAC capitalization. In addition, this business growth generated higher interest credited on policyholder account
balances as well as on certain future policyholder benefits. The aforementioned increase in our variable and universal life products was mainly driven by
our launch of a new product in the current year, coupled with ongoing organic growth in the business. The expected run-off of the traditional life closed
block offset this growth. While property & casualty sales declined, due to sluggish housing and new automobile markets, an increase in average
premium per policy in both our homeowners and auto businesses improved operating earnings by $39 million. This was partially offset by a $14 million
negative impact to operating earnings due to the decline in exposures; the negative impact from lower premiums exceeded the positive impact from
lower claims. This negative impact was coupled with a $9 million increase in expenses, mainly higher commissions, resulting from the increase in
average premium per policy.
Changes in interest rates and equity markets can significantly impact our earnings. In 2011, interest rates declined while equity markets remained
relatively flat compared with much stronger 2010 equity market performance. These changes in interest rates and equity markets reduced operating
earnings by $281 million, including the related acceleration of DAC amortization. Lower investment returns in all products and higher interest crediting
expense in the life products were partially offset by lower average interest crediting rates on annuity fixed rate funds. Our annuity interest crediting rates
continue to reflect the lower investment returns available in the marketplace, while in our other products, reduced investment returns are not reflected as
quickly in interest rates credited on policyholder account balances or on certain future policyholder benefits.
Catastrophe-related losses in our property & casualty business increased $117 million compared to 2010, mainly due to severe storm activity. Also,
2011 non-catastrophe claim costs increased $41 million as a result of higher claim frequencies, primarily due to severe winter weather, wind and hail.In
addition, a $40 million decrease in operating earnings was the result of poor mortality experience from our variable life, universal life and income annuity
businesses, partially offset by slightly improved mortality experience in the traditional life business. We review and update our long-term assumptions
used in our calculations of certain insurance-related liabilities and DAC annually, which may result in changes and are recorded in the fourth quarter
each year. This annual update, along with other reserve refinements, contributed to a net operating earnings increase of $84 million, mainly in the
universal life block of business. These favorable adjustments, primarily related to DAC unlocking, were partially offset by a $28 million charge related to
our use of the U.S. Social Security Administration’s Death Master File.
The impact of the items discussed above, related to the property & casualty business, can be seen in the unfavorable change in the combined ratio,
including catastrophes, to 107.3% in 2011 from 95.2% in 2010. The combined ratio, excluding catastrophes, was 88.2% in 2011 compared to 86.8%
in 2010.
Two items in 2011 had the net impact of a $23 million reduction to operating earnings. First, to better align with hedged risks, certain elements of our
variable annuity hedging program that were previously recorded in net investment income were recorded in net derivative gains (losses) beginning in
2011, which resulted in a decrease in operating earnings of $77 million. The second item was a reduction to our dividend scale related to our closed
block, which was announced in the fourth quarter of 2011. The impact of this action increased operating earnings by $54 million.
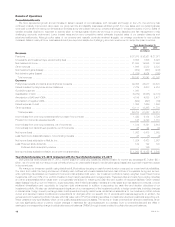
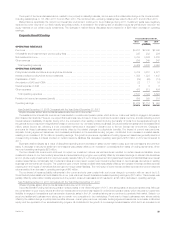
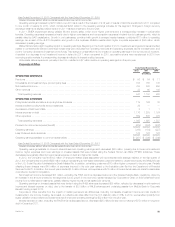
Group, Voluntary & Worksite Benefits
Years Ended December 31,
2012 2011 2010
(In millions)
OPERATING REVENUES
Premiums .................................................................................... $14,794 $13,949 $14,100
Universal life and investment-type product policy fees .................................................. 662 630 616
Net investment income .......................................................................... 1,768 1,768 1,702
Other revenues ................................................................................ 422 390 369
Total operating revenues ...................................................................... 17,646 16,737 16,787
OPERATING EXPENSES
Policyholder benefits and claims and policyholder dividends ............................................. 13,691 13,015 13,112
Interest credited to policyholder account balances .................................................... 167 178 192
Capitalization of DAC ........................................................................... (138) (176) (187)
Amortization of DAC and VOBA ................................................................... 133 186 181
Interest expense on debt ........................................................................ 1 — —
Other expenses ............................................................................... 2,351 2,198 2,193
Total operating expenses ...................................................................... 16,205 15,401 15,491
Provision for income tax expense (benefit) ........................................................... 481 445 427
Operating earnings ............................................................................. $ 960 $ 891 $ 869
MetLife, Inc. 27