MetLife 2012 Annual Report Download - page 72
Download and view the complete annual report
Please find page 72 of the 2012 MetLife annual report below. You can navigate through the pages in the report by either clicking on the pages listed below, or by using the keyword search tool below to find specific information within the annual report.-
 1
1 -
2
-
3
-
4
-
5
-
6
-
7
-
8
-
9
-
10
-
11
-
12
-
13
-
14
-
15
-
16
-
17
-
18
-
19
-
20
-
21
-
22
-
23
-
24
-
25
-
26
-
27
-
28
-
29
-
30
-
31
-
32
-
33
-
34
-
35
-
36
-
37
-
38
-
39
-
40
-
41
-
42
-
43
-
44
-
45
-
46
-
47
-
48
-
49
-
50
-
51
-
52
-
53
-
54
-
55
-
56
-
57
-
58
-
59
-
60
-
61
-
 62
62 -
 63
63 -
 64
64 -
 65
65 -
 66
66 -
 67
67 -
 68
68 -
 69
69 -
 70
70 -
 71
71 -
 72
72 -
 73
73 -
 74
74 -
 75
75 -
 76
76 -
 77
77 -
 78
78 -
 79
79 -
 80
80 -
 81
81 -
 82
82 -
83
-
84
-
85
-
86
-
87
-
88
-
89
-
90
-
91
-
92
-
93
-
94
-
95
-
96
-
97
-
98
-
99
-
100
-
101
-
102
-
103
-
104
-
105
-
106
-
107
-
108
-
109
-
110
-
111
-
112
-
113
-
114
-
115
-
116
-
117
-
118
-
119
-
120
-
121
-
122
-
123
-
124
-
125
-
126
-
127
-
128
-
129
-
130
-
131
-
132
-
133
-
134
-
135
-
136
-
137
-
138
-
139
-
140
-
141
-
142
-
143
-
144
-
145
-
146
-
147
-
148
-
149
-
150
-
151
-
152
-
153
-
154
-
155
-
156
-
157
-
158
-
159
-
160
-
161
-
162
-
163
-
164
-
165
-
166
-
167
-
168
-
169
-
170
-
171
-
172
-
173
-
174
-
175
-
176
-
177
-
178
-
179
-
180
-
181
-
182
-
183
-
184
-
185
-
186
-
187
-
188
-
189
-
190
-
191
-
192
-
193
-
194
-
195
-
196
-
197
-
198
-
199
-
200
-
201
-
202
-
203
-
204
-
205
-
206
-
207
-
208
-
209
-
210
-
211
-
212
-
213
-
214
-
215
 |
 |
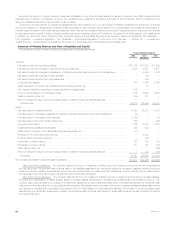
We believe the presentation of operating earnings and operating earnings available to common shareholders as we measure it for management
purposes enhances the understanding of our performance by highlighting the results of operations and the underlying profitability drivers of our
business. Operating revenues, operating expenses, operating earnings, operating earnings available to common shareholders, and operating returnon
common equity, should not be viewed as substitutes for the following financial measures calculated in accordance with GAAP: GAAP revenues, GAAP
expenses, GAAP income (loss) from continuing operations, net of income tax, GAAP net income (loss) available to MetLife, Inc.’s common
shareholders, and return on common equity, respectively. Reconciliations of these measures to the most directly comparable GAAP measures are
included in “— Results of Operations.”
In this discussion, we sometimes refer to sales activity for various products. These sales statistics do not correspond to revenues under GAAP, but
are used as relevant measures of business activity. Additionally, the impact of changes in our foreign currency exchange rates is calculated using the
average foreign currency exchange rates for the current year and is applied to each of the comparable years.
In this discussion, we also provide forward-looking guidance on an operating, or non-GAAP, basis. A reconciliation of these non-GAAP measures to
the most directly comparable GAAP measures is not accessible on a forward-looking basis because we believe it is not possible to provide other than a
range of net investment gains and losses and net derivative gains and losses, which can fluctuate significantly within or outside the range and from
period to period and may have a significant impact on GAAP net income.
Subsequent Events
See Note 23 of the Notes to the Consolidated Financial Statements.
As previously announced, Punjab National Bank (“PNB”) agreed to acquire a 30% stake in MetLife India Insurance Company Limited (“MetLife India”),
subject to regulatory approval and final agreements among PNB and the existing shareholders of MetLife India, and had entered into a separate
exclusive 10-year distribution agreement to sell MetLife India’s products through PNB’s branch network. In January 2013, PNB completed the
acquisition of the 30% stake in MetLife India. PNB is the second largest bank in India based on revenues, with approximately 5,700 branches and
70 million customers.
Quantitative and Qualitative Disclosures About Market Risk
Risk Management
We actively manage, measure and monitor the market risk associated with our assets and liabilities. We have developed an integrated process for
managing risk, which we conduct through our Global Risk Management Department, Asset/Liability Management Unit, Treasury Department and
Investments Department along with the management of our business segments. We have established and implemented comprehensive policies and
procedures at both the corporate and business segment level to minimize the effects of potential market volatility.
We regularly analyze our exposure to interest rate, equity market price and foreign currency exchange rate risks. As a result of that analysis, we have
determined that the estimated fair values of certain assets and liabilities are materially exposed to changes in interest rates, foreign currency exchange
rates and changes in the equity markets.
Global Risk Management. We have established several financial and non-financial senior management committees as part of our risk management
process. These committees manage capital and risk positions, approve ALM strategies and establish appropriate corporate business standards. Further
enhancing its committee structure, during 2010, we created an Enterprise Risk Committee. The Enterprise Risk Committee is comprised of members of
senior management, including MetLife, Inc.’s Chief Financial Officer, Chief Risk Officer and Chief Investment Officer. This committee is responsible for
reviewing all material risks to the enterprise and deciding on actions if necessary, in the event risks exceed desirable targets, taking into consideration
best practices and the current environment to resolve or mitigate those risks.
We also have a separate Global Risk Management Department, which is responsible for risk management throughout MetLife and reports to
MetLife’s Chief Risk Officer, who reports to MetLife’s Chief Executive Officer. The Global Risk Management Department’s primary responsibilities consist
of:
‰implementing a corporate risk framework, which outlines our approach for managing risk on an enterprise-wide basis;
‰developing policies and procedures for managing, measuring, monitoring and controlling those risks identified in the corporate risk framework;
‰establishing appropriate corporate risk tolerance levels;
‰deploying capital on an economic capital basis; and
‰reporting on a periodic basis to the Finance and Risk Committee of the Company’s Board of Directors; with respect to credit risk, reporting to the
Investment Committee of the Company’s Board of Directors; and reporting on various aspects of risk to financial and non-financial senior
management committees.
Asset/Liability Management. We actively manage our assets using an approach that balances quality, diversification, asset/liability matching,
liquidity, concentration and investment return. The goals of the investment process are to optimize, net of income tax, risk-adjusted investment income
and risk-adjusted total return while ensuring that the assets and liabilities are reasonably managed on a cash flow and duration basis. The ALM process
is the shared responsibility of the ALM Unit, Global Risk Management, the Portfolio Management Unit, and the senior members of the business
segments and is governed by the ALM Committees. The ALM Committees’ duties include reviewing and approving target portfolios, establishing
investment guidelines and limits and providing oversight of the ALM process on a periodic basis. The directives of the ALM Committees are carried out
and monitored through ALM Working Groups which are set up to manage by product type. In addition, an ALM Steering Committee oversees the
activities of the underlying ALM Committees.
We establish target asset portfolios for each major insurance product, which represent the investment strategies used to profitably fund our liabilities
within acceptable levels of risk. These strategies are monitored through regular review of portfolio metrics, such as effective duration, yield curve
sensitivity, convexity, liquidity, asset sector concentration and credit quality by the ALM Working Groups.
Market Risk Exposures
We have exposure to market risk through our insurance operations and investment activities. For purposes of this disclosure, “market risk” is defined
as the risk of loss resulting from changes in interest rates, foreign currency exchange rates and equity markets.
Interest Rates. Our exposure to interest rate changes results most significantly from our holdings of fixed maturity securities, as well as our interest
rate sensitive liabilities. The fixed maturity securities include U.S. and foreign government bonds, securities issued by government agencies, corporate
bonds, mortgage-backed and asset-backed securities, all of which are mainly exposed to changes in medium- and long-term interest rates. The
interest rate sensitive liabilities for purposes of this disclosure include debt, PABs related to certain investment type contracts, and net embedded
derivatives on variable annuities with guaranteed minimum benefits which have the same type of interest rate exposure (medium- and long-term interest
66 MetLife, Inc.