MetLife 2012 Annual Report Download - page 127
Download and view the complete annual report
Please find page 127 of the 2012 MetLife annual report below. You can navigate through the pages in the report by either clicking on the pages listed below, or by using the keyword search tool below to find specific information within the annual report.-
 1
1 -
2
-
3
-
4
-
5
-
6
-
7
-
8
-
9
-
10
-
11
-
12
-
13
-
14
-
15
-
16
-
17
-
18
-
19
-
20
-
21
-
22
-
23
-
24
-
25
-
26
-
27
-
28
-
29
-
30
-
31
-
32
-
33
-
34
-
35
-
36
-
37
-
38
-
39
-
40
-
41
-
42
-
43
-
44
-
45
-
46
-
47
-
48
-
49
-
50
-
51
-
52
-
53
-
54
-
55
-
56
-
57
-
58
-
59
-
60
-
61
-
62
-
63
-
64
-
65
-
66
-
67
-
68
-
69
-
70
-
71
-
72
-
73
-
74
-
75
-
76
-
77
-
78
-
79
-
80
-
81
-
82
-
83
-
84
-
85
-
86
-
87
-
88
-
89
-
90
-
91
-
92
-
93
-
94
-
95
-
96
-
97
-
98
-
99
-
100
-
101
-
102
-
103
-
104
-
105
-
106
-
107
-
108
-
109
-
110
-
111
-
112
-
113
-
114
-
115
-
116
-
 117
117 -
 118
118 -
 119
119 -
 120
120 -
 121
121 -
 122
122 -
 123
123 -
 124
124 -
 125
125 -
 126
126 -
 127
127 -
 128
128 -
 129
129 -
 130
130 -
 131
131 -
 132
132 -
 133
133 -
 134
134 -
 135
135 -
 136
136 -
 137
137 -
138
-
139
-
140
-
141
-
142
-
143
-
144
-
145
-
146
-
147
-
148
-
149
-
150
-
151
-
152
-
153
-
154
-
155
-
156
-
157
-
158
-
159
-
160
-
161
-
162
-
163
-
164
-
165
-
166
-
167
-
168
-
169
-
170
-
171
-
172
-
173
-
174
-
175
-
176
-
177
-
178
-
179
-
180
-
181
-
182
-
183
-
184
-
185
-
186
-
187
-
188
-
189
-
190
-
191
-
192
-
193
-
194
-
195
-
196
-
197
-
198
-
199
-
200
-
201
-
202
-
203
-
204
-
205
-
206
-
207
-
208
-
209
-
210
-
211
-
212
-
213
-
214
-
215
 |
 |

MetLife, Inc.
Notes to the Consolidated Financial Statements — (Continued)
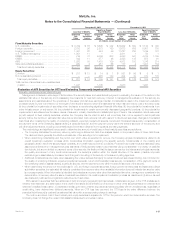
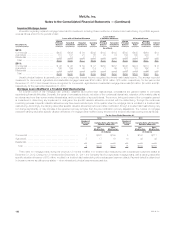
Recorded Investment
Estimated
Fair Value %of
Total
Debt Service Coverage Ratios
Total %of
Total> 1.20x 1.00x - 1.20x < 1.00x
(In millions) (In millions)
December 31, 2012:
Loan-to-value ratios:
Less than 65% .............................................. $29,839 $ 730 $ 722 $31,291 77.3% $33,730 78.3%
65%to75% ................................................ 5,057 672 153 5,882 14.6 6,129 14.2
76%to80% ................................................ 938 131 316 1,385 3.4 1,436 3.3
Greater than 80% ............................................ 1,085 552 277 1,914 4.7 1,787 4.2
Total ..................................................... $36,919 $2,085 $1,468 $40,472 100.0% $43,082 100.0%
December 31, 2011:
Loan-to-value ratios:
Less than 65% .............................................. $24,983 $ 448 $ 564 $25,995 64.3% $27,581 65.5%
65%to75% ................................................ 8,275 336 386 8,997 22.3 9,387 22.3
76%to80% ................................................ 1,150 98 226 1,474 3.6 1,473 3.5
Greater than 80% ............................................ 2,714 880 380 3,974 9.8 3,664 8.7
Total ..................................................... $37,122 $1,762 $1,556 $40,440 100.0% $42,105 100.0%
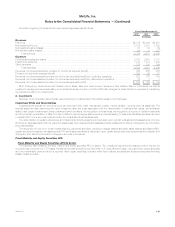
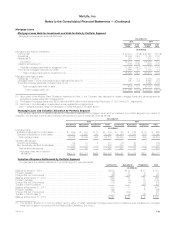
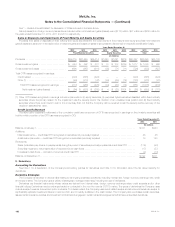
Credit Quality of Agricultural Mortgage Loans
Information about the credit quality of agricultural mortgage loans held-for-investment is presented below at:
December 31,
2012 2011
Recorded
Investment %of
Total Recorded
Investment %of
Total
(In millions) (In millions)
Loan-to-value ratios:
Less than 65% ......................................................................... $11,908 92.7% $11,802 89.9%
65%to75% ........................................................................... 590 4.6 874 6.7
76%to80% ........................................................................... 92 0.7 76 0.6
Greater than 80% ....................................................................... 253 2.0 377 2.8
Total ................................................................................ $12,843 100.0% $13,129 100.0%
The estimated fair value of agricultural mortgage loans held-for-investment was $13.3 billion and $13.6 billion at December 31, 2012 and 2011,
respectively.
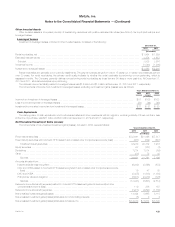
Credit Quality of Residential Mortgage Loans
Information about the credit quality of residential mortgage loans held-for-investment is presented below at:
December 31,
2012 2011
Recorded
Investment %of
Total Recorded
Investment %of
Total
(In millions) (In millions)
Performance indicators:
Performing ............................................................................ $929 97.0% $671 97.4%
Non-performing ......................................................................... 29 3.0 18 2.6
Total ................................................................................ $958 100.0% $689 100.0%
The estimated fair value of residential mortgage loans held-for-investment was $1.0 billion and $737 million at December 31, 2012 and 2011,
respectively.
Past Due and Interest Accrual Status of Mortgage Loans
The Company has a high quality, well performing, mortgage loan portfolio, with 99% of all mortgage loans classified as performing at both
December 31, 2012 and 2011. The Company defines delinquent mortgage loans consistent with industry practice, when interest and principal
payments are past due as follows: commercial and residential mortgage loans – 60 days; and agricultural mortgage loans – 90 days. The recorded
investment in mortgage loans held-for-investment, prior to valuation allowances, past due according to these aging categories, greater than 90 days
past due and still accruing interest and in nonaccrual status, by portfolio segment, were as follows at:
Past Due Greater than 90 Days Past Due
and Still Accruing Interest Nonaccrual Status
December 31, 2012 December 31, 2011 December 31, 2012 December 31, 2011 December 31, 2012 December 31, 2011
(In millions)
Commercial .................. $ 2 $ 63 $— $— $ 84 $ 63
Agricultural ................... 116 146 53 29 67 157
Residential ................... 29 8 — — 18 17
Total ...................... $147 $217 $53 $29 $169 $237
MetLife, Inc. 121