MetLife 2012 Annual Report Download - page 104
Download and view the complete annual report
Please find page 104 of the 2012 MetLife annual report below. You can navigate through the pages in the report by either clicking on the pages listed below, or by using the keyword search tool below to find specific information within the annual report.-
 1
1 -
2
-
3
-
4
-
5
-
6
-
7
-
8
-
9
-
10
-
11
-
12
-
13
-
14
-
15
-
16
-
17
-
18
-
19
-
20
-
21
-
22
-
23
-
24
-
25
-
26
-
27
-
28
-
29
-
30
-
31
-
32
-
33
-
34
-
35
-
36
-
37
-
38
-
39
-
40
-
41
-
42
-
43
-
44
-
45
-
46
-
47
-
48
-
49
-
50
-
51
-
52
-
53
-
54
-
55
-
56
-
57
-
58
-
59
-
60
-
61
-
62
-
63
-
64
-
65
-
66
-
67
-
68
-
69
-
70
-
71
-
72
-
73
-
74
-
75
-
76
-
77
-
78
-
79
-
80
-
81
-
82
-
83
-
84
-
85
-
86
-
87
-
88
-
89
-
90
-
91
-
92
-
93
-
 94
94 -
 95
95 -
 96
96 -
 97
97 -
 98
98 -
 99
99 -
 100
100 -
 101
101 -
 102
102 -
 103
103 -
 104
104 -
 105
105 -
 106
106 -
 107
107 -
 108
108 -
 109
109 -
 110
110 -
 111
111 -
 112
112 -
 113
113 -
 114
114 -
115
-
116
-
117
-
118
-
119
-
120
-
121
-
122
-
123
-
124
-
125
-
126
-
127
-
128
-
129
-
130
-
131
-
132
-
133
-
134
-
135
-
136
-
137
-
138
-
139
-
140
-
141
-
142
-
143
-
144
-
145
-
146
-
147
-
148
-
149
-
150
-
151
-
152
-
153
-
154
-
155
-
156
-
157
-
158
-
159
-
160
-
161
-
162
-
163
-
164
-
165
-
166
-
167
-
168
-
169
-
170
-
171
-
172
-
173
-
174
-
175
-
176
-
177
-
178
-
179
-
180
-
181
-
182
-
183
-
184
-
185
-
186
-
187
-
188
-
189
-
190
-
191
-
192
-
193
-
194
-
195
-
196
-
197
-
198
-
199
-
200
-
201
-
202
-
203
-
204
-
205
-
206
-
207
-
208
-
209
-
210
-
211
-
212
-
213
-
214
-
215
 |
 |

MetLife, Inc.
Notes to the Consolidated Financial Statements — (Continued)
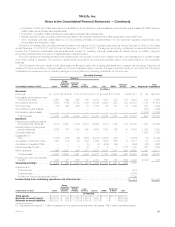
Operating Earnings
Americas
Year Ended December 31, 2011 Retail
Group,
Voluntary
& Worksite
Benefits
Corporate
Benefit
Funding Latin
America Total Asia EMEA Corporate
& Other Total Adjustments Total
Consolidated
(In millions)
Revenues
Premiums ................... $ 6,711 $13,949 $ 2,848 $ 2,514 $ 26,022 $ 7,716 $ 2,477 $ 54 $36,269 $ 92 $36,361
Universal life and investment-type
product policy fees .......... 4,096 630 232 757 5,715 1,343 315 155 7,528 278 7,806
Net investment income ......... 7,414 1,768 5,506 1,025 15,713 2,475 562 888 19,638 (53) 19,585
Other revenues ............... 779 390 249 15 1,433 36 123 60 1,652 880 2,532
Net investment gains (losses) .... — — — — — — — — — (867) (867)
Net derivative gains (losses) ..... — — — — — — — — — 4,824 4,824
Total revenues ............. 19,000 16,737 8,835 4,311 48,883 11,570 3,477 1,157 65,087 5,154 70,241
Expenses
Policyholder benefits and claims
and policyholder dividends .... 9,220 13,015 5,287 2,064 29,586 5,239 1,290 126 36,241 676 36,917
Interest credited to policyholder
account balances ........... 2,412 178 1,323 371 4,284 1,607 166 — 6,057 (454) 5,603
Goodwill impairment ........... — — — — — — — — — — —
Capitalization of DAC .......... (2,339) (176) (25) (295) (2,835) (2,045) (669) — (5,549) (9) (5,558)
Amortization of DAC and VOBA . . 1,845 186 17 207 2,255 1,486 613 1 4,355 543 4,898
Amortization of negative VOBA . . . — — — (6) (6) (560) (53) — (619) (78) (697)
Interest expense on debt ....... 1 — 9 1 11 — — 1,293 1,304 325 1,629
Other expenses .............. 5,854 2,198 513 1,305 9,870 4,522 1,723 505 16,620 1,645 18,265
Total expenses ............. 16,993 15,401 7,124 3,647 43,165 10,249 3,070 1,925 58,409 2,648 61,057
Provision for income tax expense
(benefit) ................... 672 445 599 150 1,866 441 156 (584) 1,879 914 2,793
Operating earnings ......... $ 1,335 $ 891 $ 1,112 $ 514 $ 3,852 $ 880 $ 251 $ (184) 4,799
Adjustments to:
Total revenues ............................................................................... 5,154
Total expenses ............................................................................... (2,648)
Provision for income tax (expense) benefit .......................................................... (914)
Income (loss) from continuing operations, net of income tax ....................................... $ 6,391 $ 6,391
At December 31, 2011 Retail
Group,
Voluntary
& Worksite
Benefits
Corporate
Benefit
Funding Latin
America Asia (1) EMEA Corporate
& Other Total
(In millions)
Total assets ................ $301,591 $45,197 $195,217 $20,315 $ 115,806 $30,040 $88,060 $796,226
Separate account assets .... $128,208 $ 479 $ 64,851 $ 2,880 $ 6,599 $ 6 $ — $203,023
Separate account liabilities .. $128,208 $ 479 $ 64,851 $ 2,880 $ 6,599 $ 6 $ — $203,023
(1) Total assets includes $103.9 billion of assets from the Japan operations which represents 13% of total consolidated assets.
98 MetLife, Inc.