MetLife 2012 Annual Report Download - page 20
Download and view the complete annual report
Please find page 20 of the 2012 MetLife annual report below. You can navigate through the pages in the report by either clicking on the pages listed below, or by using the keyword search tool below to find specific information within the annual report.-
 1
1 -
2
-
3
-
4
-
5
-
6
-
7
-
8
-
9
-
 10
10 -
 11
11 -
 12
12 -
 13
13 -
 14
14 -
 15
15 -
 16
16 -
 17
17 -
 18
18 -
 19
19 -
 20
20 -
 21
21 -
 22
22 -
 23
23 -
 24
24 -
 25
25 -
 26
26 -
 27
27 -
 28
28 -
 29
29 -
 30
30 -
31
-
32
-
33
-
34
-
35
-
36
-
37
-
38
-
39
-
40
-
41
-
42
-
43
-
44
-
45
-
46
-
47
-
48
-
49
-
50
-
51
-
52
-
53
-
54
-
55
-
56
-
57
-
58
-
59
-
60
-
61
-
62
-
63
-
64
-
65
-
66
-
67
-
68
-
69
-
70
-
71
-
72
-
73
-
74
-
75
-
76
-
77
-
78
-
79
-
80
-
81
-
82
-
83
-
84
-
85
-
86
-
87
-
88
-
89
-
90
-
91
-
92
-
93
-
94
-
95
-
96
-
97
-
98
-
99
-
100
-
101
-
102
-
103
-
104
-
105
-
106
-
107
-
108
-
109
-
110
-
111
-
112
-
113
-
114
-
115
-
116
-
117
-
118
-
119
-
120
-
121
-
122
-
123
-
124
-
125
-
126
-
127
-
128
-
129
-
130
-
131
-
132
-
133
-
134
-
135
-
136
-
137
-
138
-
139
-
140
-
141
-
142
-
143
-
144
-
145
-
146
-
147
-
148
-
149
-
150
-
151
-
152
-
153
-
154
-
155
-
156
-
157
-
158
-
159
-
160
-
161
-
162
-
163
-
164
-
165
-
166
-
167
-
168
-
169
-
170
-
171
-
172
-
173
-
174
-
175
-
176
-
177
-
178
-
179
-
180
-
181
-
182
-
183
-
184
-
185
-
186
-
187
-
188
-
189
-
190
-
191
-
192
-
193
-
194
-
195
-
196
-
197
-
198
-
199
-
200
-
201
-
202
-
203
-
204
-
205
-
206
-
207
-
208
-
209
-
210
-
211
-
212
-
213
-
214
-
215
 |
 |
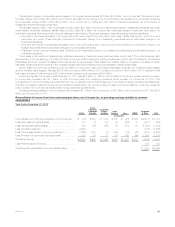
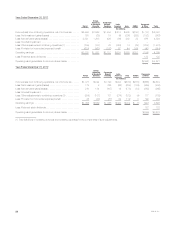
The following represents significant items contributing to the changes to DAC and VOBA amortization in 2012:
‰The increase in actual, as well as changes in projected, investment returns resulted in an increase in actual and a reduction in expected future
gross profits on variable universal life contracts and variable deferred annuity contracts resulting in an increase of $161 million in DAC and VOBA
amortization.
‰Better than expected persistency and changes in assumptions regarding persistency, especially in the U.S. deferred variable annuity contracts,
resulted in an increase in actual and expected future gross profits resulting in a decrease of $368 million in DAC and VOBA amortization.
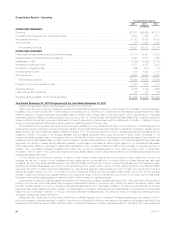
The following represents significant items contributing to the changes to DAC and VOBA amortization in 2011:
‰The decrease in equity markets during the year lowered separate account balances, which led to a reduction in actual and expected future gross
profits on variable universal life contracts and variable deferred annuity contracts resulting in an increase of $125 million in DAC and VOBA
amortization.
‰Changes in net investment gains (losses) resulted in the following changes in DAC and VOBA amortization:
– Actual gross profits decreased as a result of an increase in liabilities associated with guarantee obligations on variable annuities, resulting in a
decrease of DAC and VOBA amortization of $478 million, excluding the impact from our nonperformance risk and risk margins, which are
described below. This decrease in actual gross profits was more than offset by freestanding derivative gains associated with the hedging of
such guarantee obligations, which resulted in an increase in DAC and VOBA amortization of $759 million.
– The widening of the Company’s nonperformance risk adjustment decreased the valuation of guarantee liabilities, increased actual gross profits
and increased DAC and VOBA amortization by $234 million. This was partially offset by higher risk margins, which increased the guarantee
liability valuations, decreased actual gross profits and decreased DAC and VOBA amortization by $64 million.
– The remainder of the impact of net investment gains (losses), which increased DAC and VOBA amortization by $79 million, was primarily
attributable to current period investment activities.
The following represents significant items contributing to the changes to DAC and VOBA amortization in 2010:
‰Changes in net investment gains (losses) resulted in the following changes in DAC and VOBA amortization:
– Actual gross profits increased as a result of a decrease in liabilities associated with guarantee obligations on variable annuities, resulting in an
increase of DAC and VOBA amortization of $188 million, excluding the impact from our nonperformance risk and risk margins, which are
described below. This increase in actual gross profits was partially offset by freestanding derivative losses associated with the hedging of such
guarantee obligations, which resulted in a decrease in DAC and VOBA amortization of $84 million.
– The narrowing of our nonperformance risk adjustment increased the valuation of guarantee liabilities, decreased actual gross profits and
decreased DAC and VOBA amortization by $92 million. In addition, higher risk margins, which increased the guarantee liability valuations,
decreased actual gross profits and decreased DAC and VOBA amortization by $17 million.
– The remainder of the impact of net investment gains (losses), which increased DAC and VOBA amortization by $114 million, was primarily
attributable to current period investment activities.
‰Included in policyholder dividends and other was an increase in DAC and VOBA amortization of $72 million as a result of favorable gross margin
variances. The remainder of the increase was due to various immaterial items.
Our DAC and VOBA balance is also impacted by unrealized investment gains (losses) and the amount of amortization which would have been
recognized if such gains and losses had been realized. The increase in unrealized investment gains decreased the DAC and VOBA balance by $713
million, $788 million and $1.2 billion in 2012, 2011 and 2010, respectively. See Notes 5 and 8 of the Notes to the Consolidated Financial Statements
for information regarding the DAC and VOBA offset to unrealized investment losses.
Estimated Fair Value of Investments
In determining the estimated fair value of our investments, various methodologies, assumptions and inputs are utilized.
When quoted prices in active markets are not available, the determination of estimated fair value is based on market standard valuation
methodologies, giving priority to observable inputs. The market standard valuation methodologies utilized include: discounted cash flow methodologies,
matrix pricing or other similar techniques. The inputs to these market standard valuation methodologies include, but are not limited to: interest rates,
credit standing of the issuer or counterparty, industry sector of the issuer, coupon rate, call provisions, sinking fund requirements, maturity, estimated
duration and management’s assumptions regarding liquidity and estimated future cash flows. Accordingly, the estimated fair values are based on
available market information and management’s judgments about financial instruments.
The significant inputs to the market standard valuation methodologies for certain types of securities with reasonable levels of price transparency are
inputs that are observable in the market or can be derived principally from or corroborated by observable market data. Such observable inputs include
benchmarking prices for similar assets in active, liquid markets, quoted prices in markets that are not active and observable yields and spreads in the
market.
When observable inputs are not available, the market standard valuation methodologies for determining the estimated fair value of certain types of
securities that trade infrequently, and therefore have little or no price transparency, rely on inputs that are significant to the estimated fair value that are
not observable in the market or cannot be derived principally from or corroborated by observable market data. These unobservable inputs can be based
in large part on management judgment or estimation, and cannot be supported by reference to market activity. Even though unobservable, these inputs
are based on assumptions deemed appropriate given the circumstances and consistent with what other market participants would use when pricing
such securities.
The estimated fair value of residential mortgage loans held-for-sale and securitized reverse residential mortgage loans is determined based on
observable pricing for securities backed by similar types of loans, adjusted to convert the securities prices to loan prices, or from independent broker
quotations, which is intended to approximate the amounts that would be received from third parties. Certain other mortgage loans that were previously
designated as held-for-investment, but now are designated as held-for-sale, are recorded at the lower of amortized cost or estimated fair value, or for
collateral dependent loans, estimated fair value of the collateral less expected disposition costs determined on an individual loan basis. For these loans,
estimated fair value is determined using independent broker quotations, or values provided by independent valuation specialists, or when the loan isin
foreclosure or otherwise collateral dependent, the estimated fair value of the underlying collateral is estimated using internal models.
Financial markets are susceptible to severe events evidenced by rapid depreciation in asset values accompanied by a reduction in asset liquidity.
Our ability to sell securities, or the price ultimately realized for these securities, depends upon the demand and liquidity in the market and increases the
use of judgment in determining the estimated fair value of certain securities.
See Note 10 of the Notes to the Consolidated Financial Statements for additional information regarding the estimated fair value of our investments.
14 MetLife, Inc.