MetLife 2012 Annual Report Download - page 75
Download and view the complete annual report
Please find page 75 of the 2012 MetLife annual report below. You can navigate through the pages in the report by either clicking on the pages listed below, or by using the keyword search tool below to find specific information within the annual report.-
 1
1 -
2
-
3
-
4
-
5
-
6
-
7
-
8
-
9
-
10
-
11
-
12
-
13
-
14
-
15
-
16
-
17
-
18
-
19
-
20
-
21
-
22
-
23
-
24
-
25
-
26
-
27
-
28
-
29
-
30
-
31
-
32
-
33
-
34
-
35
-
36
-
37
-
38
-
39
-
40
-
41
-
42
-
43
-
44
-
45
-
46
-
47
-
48
-
49
-
50
-
51
-
52
-
53
-
54
-
55
-
56
-
57
-
58
-
59
-
60
-
61
-
62
-
63
-
64
-
 65
65 -
 66
66 -
 67
67 -
 68
68 -
 69
69 -
 70
70 -
 71
71 -
 72
72 -
 73
73 -
 74
74 -
 75
75 -
 76
76 -
 77
77 -
 78
78 -
 79
79 -
 80
80 -
 81
81 -
 82
82 -
 83
83 -
 84
84 -
 85
85 -
86
-
87
-
88
-
89
-
90
-
91
-
92
-
93
-
94
-
95
-
96
-
97
-
98
-
99
-
100
-
101
-
102
-
103
-
104
-
105
-
106
-
107
-
108
-
109
-
110
-
111
-
112
-
113
-
114
-
115
-
116
-
117
-
118
-
119
-
120
-
121
-
122
-
123
-
124
-
125
-
126
-
127
-
128
-
129
-
130
-
131
-
132
-
133
-
134
-
135
-
136
-
137
-
138
-
139
-
140
-
141
-
142
-
143
-
144
-
145
-
146
-
147
-
148
-
149
-
150
-
151
-
152
-
153
-
154
-
155
-
156
-
157
-
158
-
159
-
160
-
161
-
162
-
163
-
164
-
165
-
166
-
167
-
168
-
169
-
170
-
171
-
172
-
173
-
174
-
175
-
176
-
177
-
178
-
179
-
180
-
181
-
182
-
183
-
184
-
185
-
186
-
187
-
188
-
189
-
190
-
191
-
192
-
193
-
194
-
195
-
196
-
197
-
198
-
199
-
200
-
201
-
202
-
203
-
204
-
205
-
206
-
207
-
208
-
209
-
210
-
211
-
212
-
213
-
214
-
215
 |
 |

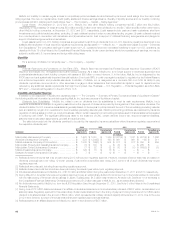
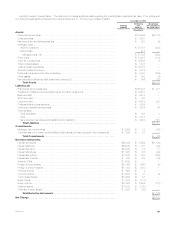
Sensitivity Analysis: Interest Rates. The table below provides additional detail regarding the potential loss in estimated fair value of our trading and
non-trading interest sensitive financial instruments at December 31, 2012 by type of asset or liability: December 31, 2012
Notional
Amount
Estimated
Fair
Value (1)
Assuming a
10% Increase in
the Yield Curve
(In millions)
Assets:
Fixed maturity securities .............................................................. $374,266 $(5,110)
Equity securities .................................................................... $ 2,891 —
Fair value option and trading securities .................................................. $ 883 (5)
Mortgage loans: ....................................................................
Held-for-investment ............................................................... $ 57,381 (220)
Held-for-sale ..................................................................... 414 —
Mortgage loans, net ............................................................. $ 57,795 (220)
Policy loans ....................................................................... $ 14,257 (112)
Short-term investments .............................................................. $ 16,906 (1)
Other invested assets ............................................................... $ 1,241 —
Cash and cash equivalents ........................................................... $ 15,738 —
Accrued investment income ........................................................... $ 4,374 —
Premiums, reinsurance and other receivables ............................................. $ 3,705 (236)
Other assets ....................................................................... $ 292 (6)
Net embedded derivatives within asset host contracts (2) .................................... $ 506 (22)
Total Assets .................................................................. $(5,712)
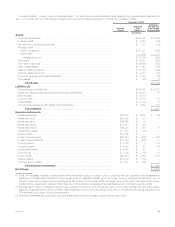
Liabilities: (3)
Policyholder account balances ........................................................ $150,497 $ 477
Payables for collateral under securities loaned and other transactions ........................... $ 33,687 —
Bank deposits ..................................................................... $ 6,416 —
Short-term debt .................................................................... $ 100 —
Long-term debt .................................................................... $ 18,978 225
Collateral financing arrangements ...................................................... $ 3,839 —
Junior subordinated debt securities ..................................................... $ 3,984 94
Other liabilities: .....................................................................
Trading liabilities .................................................................. $ 163 3
Other .......................................................................... $ 1,916 —
Net embedded derivatives within liability host contracts (2) ................................. $ 3,684 518
Total Liabilities ............................................................... $ 1,317
Commitments:
Mortgage loan commitments .......................................................... $ 2,969 $ 12 (20)
Commitments to fund bank credit facilities, bridge loans and private corporate bond investments ..... $ 1,243 $ 22 —
Total Commitments ........................................................... $ (20)
Derivative Instruments:
Interest rate swaps .................................................................. $92,289 $ 5,694 $(1,120)
Interest rate floors ................................................................... $56,246 $ 337 (29)
Interest rate caps ................................................................... $49,465 $ 74 17
Interest rate futures .................................................................. $11,684 $ (37) (92)
Interest rate options ................................................................. $16,328 $ 580 (206)
Interest rate forwards ................................................................ $ 675 $ 139 (44)
Synthetic GICs ..................................................................... $ 4,162 $ — —
Foreign currency swaps .............................................................. $20,433 $ (426) (9)
Foreign currency forwards ............................................................ $11,754 $ (280) —
Currency futures .................................................................... $ 1,408 $ 4 —
Currency options ................................................................... $ 4,504 $ 41 (2)
Credit default swaps ................................................................ $12,553 $ 51 —
Equity futures ...................................................................... $ 7,008 $ (118) —
Equity options ...................................................................... $22,920 $ 2,469 (101)
Variance swaps .................................................................... $19,830 $ (188) —
Total rate of return swaps ............................................................. $ 3,092 $ (99) —
Total Derivative Instruments ................................................... $(1,586)
Net Change ........................................................................ $(6,001)
MetLife, Inc. 69