MetLife 2012 Annual Report Download - page 133
Download and view the complete annual report
Please find page 133 of the 2012 MetLife annual report below. You can navigate through the pages in the report by either clicking on the pages listed below, or by using the keyword search tool below to find specific information within the annual report.-
 1
1 -
2
-
3
-
4
-
5
-
6
-
7
-
8
-
9
-
10
-
11
-
12
-
13
-
14
-
15
-
16
-
17
-
18
-
19
-
20
-
21
-
22
-
23
-
24
-
25
-
26
-
27
-
28
-
29
-
30
-
31
-
32
-
33
-
34
-
35
-
36
-
37
-
38
-
39
-
40
-
41
-
42
-
43
-
44
-
45
-
46
-
47
-
48
-
49
-
50
-
51
-
52
-
53
-
54
-
55
-
56
-
57
-
58
-
59
-
60
-
61
-
62
-
63
-
64
-
65
-
66
-
67
-
68
-
69
-
70
-
71
-
72
-
73
-
74
-
75
-
76
-
77
-
78
-
79
-
80
-
81
-
82
-
83
-
84
-
85
-
86
-
87
-
88
-
89
-
90
-
91
-
92
-
93
-
94
-
95
-
96
-
97
-
98
-
99
-
100
-
101
-
102
-
103
-
104
-
105
-
106
-
107
-
108
-
109
-
110
-
111
-
112
-
113
-
114
-
115
-
116
-
117
-
118
-
119
-
120
-
121
-
122
-
 123
123 -
 124
124 -
 125
125 -
 126
126 -
 127
127 -
 128
128 -
 129
129 -
 130
130 -
 131
131 -
 132
132 -
 133
133 -
 134
134 -
 135
135 -
 136
136 -
 137
137 -
 138
138 -
 139
139 -
 140
140 -
 141
141 -
 142
142 -
 143
143 -
144
-
145
-
146
-
147
-
148
-
149
-
150
-
151
-
152
-
153
-
154
-
155
-
156
-
157
-
158
-
159
-
160
-
161
-
162
-
163
-
164
-
165
-
166
-
167
-
168
-
169
-
170
-
171
-
172
-
173
-
174
-
175
-
176
-
177
-
178
-
179
-
180
-
181
-
182
-
183
-
184
-
185
-
186
-
187
-
188
-
189
-
190
-
191
-
192
-
193
-
194
-
195
-
196
-
197
-
198
-
199
-
200
-
201
-
202
-
203
-
204
-
205
-
206
-
207
-
208
-
209
-
210
-
211
-
212
-
213
-
214
-
215
 |
 |

MetLife, Inc.
Notes to the Consolidated Financial Statements — (Continued)
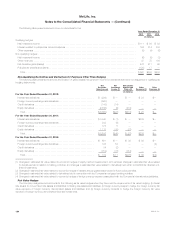
December 31,
2012 2011
Total
Assets Total
Liabilities Total
Assets Total
Liabilities
(In millions)
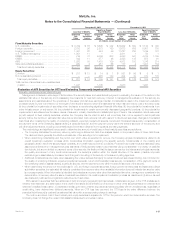
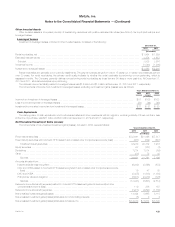
CSEs (assets (primarily loans) and liabilities (primarily debt)) (1) ............................... $ 2,730 $ 2,545 $ 3,299 $ 3,103
MRSC (collateral financing arrangement (primarily securities)) (2) ............................. 3,439 — 3,333 —
Other limited partnership interests ..................................................... 356 8 360 6
FVO and trading securities .......................................................... 71 — 163 —
Other invested assets .............................................................. 85 — 102 1
Real estate joint ventures ........................................................... 11 14 16 18
Total ......................................................................... $ 6,692 $ 2,567 $ 7,273 $ 3,128
(1) The Company consolidates former QSPEs that are structured as CMBS and as collateralized debt obligations. The assets of these entities can
only be used to settle their respective liabilities, and under no circumstances is the Company liable for any principal or interest shortfalls should
any arise. The assets and liabilities of these CSEs are primarily commercial mortgage loans held-for-investment and long-term debt, respectively,
and to a lesser extent include FVO and trading securities, accrued investment income, cash and cash equivalents, premiums, reinsurance and
other receivables and other liabilities. The Company’s exposure was limited to that of its remaining investment in the former QSPEs of $168 million
and $172 million at estimated fair value at December 31, 2012 and 2011, respectively. The long-term debt bears interest primarily at fixed rates
ranging from 2.25% to 5.57%, payable primarily on a monthly basis. Interest expense related to these obligations, included in other expenses, was
$163 million, $324 million and $411 million for the years ended December 31, 2012, 2011 and 2010 respectively.
(2) See Note 13 for a description of the MetLife Reinsurance Company of South Carolina (“MRSC”) collateral financing arrangement. These assets
primarily consist of fixed maturity securities and, to a much lesser extent, mortgage loans and cash and cash equivalents.
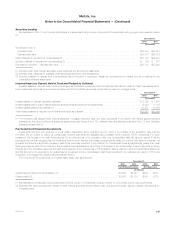
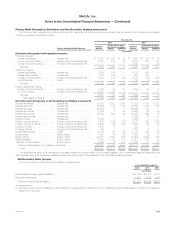
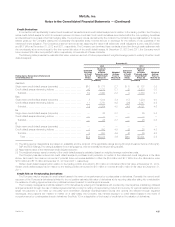
Unconsolidated VIEs
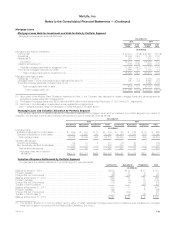
The carrying amount and maximum exposure to loss relating to VIEs in which the Company holds a significant variable interest but is not the primary
beneficiary and which have not been consolidated were as follows at:
December 31,
2012 2011
Carrying
Amount
Maximum
Exposure
to Loss
(1) Carrying
Amount
Maximum
Exposure
to Loss
(1)
(In millions)
Fixed maturity securities AFS:
Structured securities (RMBS, CMBS and ABS) (2) ......................................... $72,605 $72,605 $74,685 $74,685
U.S. and foreign corporate ............................................................ 5,287 5,287 4,998 4,998
Other limited partnership interests ........................................................ 4,436 5,908 4,340 6,084
Other invested assets ................................................................. 1,117 1,431 799 1,194
FVO and trading securities .............................................................. 563 563 671 671
Mortgage loans ...................................................................... 351 351 456 456
Real estate joint ventures ............................................................... 150 157 61 79
Equity securities AFS:
Non-redeemable preferred ............................................................ 32 32 — —
Total ........................................................................... $84,541 $86,334 $86,010 $88,167
(1) The maximum exposure to loss relating to fixed maturity securities and the FVO and trading securities is equal to their carrying amounts or the
carrying amounts of retained interests. The maximum exposure to loss relating to other limited partnership interests and real estate joint ventures is
equal to the carrying amounts plus any unfunded commitments of the Company. The maximum exposure to loss relating to mortgage loans is equal
to the carrying amounts plus any unfunded commitments of the Company. For certain of its investments in other invested assets, the Company’s
return is in the form of income tax credits which are guaranteed by creditworthy third parties. For such investments, the maximum exposure to loss is
equal to the carrying amounts plus any unfunded commitments, reduced by income tax credits guaranteed by third parties of $318 million and
$267 million at December 31, 2012 and 2011, respectively. Such a maximum loss would be expected to occur only upon bankruptcy of the issuer
or investee.
(2) For these variable interests, the Company’s involvement is limited to that of a passive investor.
As described in Note 21, the Company makes commitments to fund partnership investments in the normal course of business. Excluding these
commitments, the Company did not provide financial or other support to investees designated as VIEs during the years ended December 31, 2012,
2011 and 2010.
MetLife, Inc. 127