MetLife 2012 Annual Report Download - page 59
Download and view the complete annual report
Please find page 59 of the 2012 MetLife annual report below. You can navigate through the pages in the report by either clicking on the pages listed below, or by using the keyword search tool below to find specific information within the annual report.-
 1
1 -
2
-
3
-
4
-
5
-
6
-
7
-
8
-
9
-
10
-
11
-
12
-
13
-
14
-
15
-
16
-
17
-
18
-
19
-
20
-
21
-
22
-
23
-
24
-
25
-
26
-
27
-
28
-
29
-
30
-
31
-
32
-
33
-
34
-
35
-
36
-
37
-
38
-
39
-
40
-
41
-
42
-
43
-
44
-
45
-
46
-
47
-
48
-
 49
49 -
 50
50 -
 51
51 -
 52
52 -
 53
53 -
 54
54 -
 55
55 -
 56
56 -
 57
57 -
 58
58 -
 59
59 -
 60
60 -
 61
61 -
 62
62 -
 63
63 -
 64
64 -
 65
65 -
 66
66 -
 67
67 -
 68
68 -
 69
69 -
70
-
71
-
72
-
73
-
74
-
75
-
76
-
77
-
78
-
79
-
80
-
81
-
82
-
83
-
84
-
85
-
86
-
87
-
88
-
89
-
90
-
91
-
92
-
93
-
94
-
95
-
96
-
97
-
98
-
99
-
100
-
101
-
102
-
103
-
104
-
105
-
106
-
107
-
108
-
109
-
110
-
111
-
112
-
113
-
114
-
115
-
116
-
117
-
118
-
119
-
120
-
121
-
122
-
123
-
124
-
125
-
126
-
127
-
128
-
129
-
130
-
131
-
132
-
133
-
134
-
135
-
136
-
137
-
138
-
139
-
140
-
141
-
142
-
143
-
144
-
145
-
146
-
147
-
148
-
149
-
150
-
151
-
152
-
153
-
154
-
155
-
156
-
157
-
158
-
159
-
160
-
161
-
162
-
163
-
164
-
165
-
166
-
167
-
168
-
169
-
170
-
171
-
172
-
173
-
174
-
175
-
176
-
177
-
178
-
179
-
180
-
181
-
182
-
183
-
184
-
185
-
186
-
187
-
188
-
189
-
190
-
191
-
192
-
193
-
194
-
195
-
196
-
197
-
198
-
199
-
200
-
201
-
202
-
203
-
204
-
205
-
206
-
207
-
208
-
209
-
210
-
211
-
212
-
213
-
214
-
215
 |
 |

As part of our risk management of the GMDB business, we have been opportunistically reinsuring in-force blocks, taking advantage of favorable
capital market conditions. Our approach for such treaties has been to seek coverage for the enhanced GMDB, such as the annual step-up and the roll-
up and step-up combination. These treaties tend to cover long periods until claims start running off, and are written either on a first dollar basis or with a
deductible.
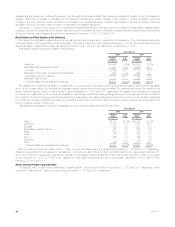
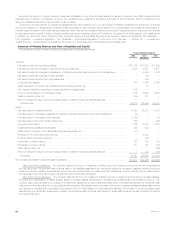
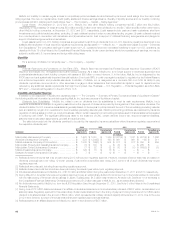
Living Benefit Guarantees
The table below presents our living benefit guarantees based on total contract account values at December 31, 2012:
Total Contract
Account Value (1)
Americas Corporate
& Other
(In millions)
GMIB ............................................................................... $ 87,530 $ —
GMWB - non-life contingent .............................................................. 7,157 4,079
GMWB - life-contingent ................................................................. 15,705 10,735
GMAB .............................................................................. 443 2,486
$110,835 $17,300
(1) Total contract account value above excludes $49.5 billion for contracts with no living benefit guarantees and approximately $8 billion of total contract
account value in the EMEA and Asia regions.
In terms of total contract account value, GMIB is our most significant living benefit guarantee. Our primary risk management strategy for our GMIB
products is our derivatives hedging program as discussed below. Additionally, we have engaged in certain reinsurance treaties covering some of our
GMIB business. As part of our overall risk management approach for living benefit guarantees, we continually monitor the reinsurance markets for the
right opportunity to purchase additional coverage for our GMIB business.
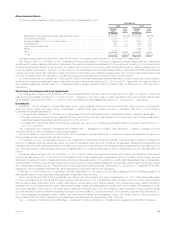
The table below presents our GMIB, by their guaranteed payout basis, at December 31, 2012:
Total Contract
Account Value
(In millions)
7-year setback, 2.5% interest rate .................................................................. $34,072
7-year setback, 1.5% interest rate .................................................................. 5,568
10-year setback, 1.5% interest rate ................................................................. 18,774
10-year mortality projection, 10-year setback, 1.0% interest rate .......................................... 26,860
10-year mortality projection, 10-year setback, 0.5% interest rate .......................................... 2,256
$ 87,530
The annuitization interest rates on GMIB have been decreased from 2.5% to 0.5% over time, partially in response to the low interest rate
environment, accompanied by an increase in the setback period from seven years to 10 years and the recent introduction of the 10-year mortality
projection. We expect new contracts to have comparable guarantee features for the foreseeable future.
Additionally, 27% of the $87.5 billion of GMIB total contract account value has been invested in managed volatility funds as of December 31, 2012.
These funds seek to manage volatility by adjusting the fund holdings within certain guidelines based on capital market movements. Such activity
reduces the overall risk of the underlying funds while maintaining their growth opportunities. These risk mitigation techniques translate to a reduction or
elimination of the need for us to manage the funds’ volatility through hedging or reinsurance. We expect the proportion of total contract account value
invested in these funds to increase for the foreseeable future, as new contracts with GMIB are required to invest in these funds.
Our GMIB products typically have a waiting period of 10 years to be eligible for annuitization. As of December 31, 2012, only 2.4% of our contracts
with GMIB were eligible for annuitization. The remaining contracts are not eligible for annuitization for an average of 6.4 years.
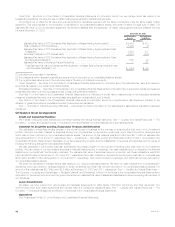
Once eligible for annuitization, contractholders would only be expected to annuitize if their contracts were in-the-money. We calculate in-the-
moneyness with respect to GMIB consistent with net amount at risk as discussed in Note 4 of the Notes to the Consolidated Financial Statements, by
comparing the contractholders’ income benefits based on total contract account values and current annuity rates versus the guaranteed income
benefits. For those contracts with GMIB, the table below presents details of contracts that are in-the-money and out-of-the money at December 31,
2012:
In-the-
Moneyness
Total Contract
Account
Value % of Total
(In millions)
In-the-money 30% + $ 3,779 4.3%
20% to 30% 3,868 4.4%
10% to 20% 6,290 7.2%
0% to 10% 8,161 9.3%
22,098
Out-of-the-money -10% to 0% 12,482 14.3%
-20% to -10% 6,323 7.2%
-20% + 46,627 53.3%
65,432
Total GMIB $87,530
MetLife, Inc. 53