MetLife 2012 Annual Report Download - page 49
Download and view the complete annual report
Please find page 49 of the 2012 MetLife annual report below. You can navigate through the pages in the report by either clicking on the pages listed below, or by using the keyword search tool below to find specific information within the annual report.-
 1
1 -
2
-
3
-
4
-
5
-
6
-
7
-
8
-
9
-
10
-
11
-
12
-
13
-
14
-
15
-
16
-
17
-
18
-
19
-
20
-
21
-
22
-
23
-
24
-
25
-
26
-
27
-
28
-
29
-
30
-
31
-
32
-
33
-
34
-
35
-
36
-
37
-
38
-
 39
39 -
 40
40 -
 41
41 -
 42
42 -
 43
43 -
 44
44 -
 45
45 -
 46
46 -
 47
47 -
 48
48 -
 49
49 -
 50
50 -
 51
51 -
 52
52 -
 53
53 -
 54
54 -
 55
55 -
 56
56 -
 57
57 -
 58
58 -
 59
59 -
60
-
61
-
62
-
63
-
64
-
65
-
66
-
67
-
68
-
69
-
70
-
71
-
72
-
73
-
74
-
75
-
76
-
77
-
78
-
79
-
80
-
81
-
82
-
83
-
84
-
85
-
86
-
87
-
88
-
89
-
90
-
91
-
92
-
93
-
94
-
95
-
96
-
97
-
98
-
99
-
100
-
101
-
102
-
103
-
104
-
105
-
106
-
107
-
108
-
109
-
110
-
111
-
112
-
113
-
114
-
115
-
116
-
117
-
118
-
119
-
120
-
121
-
122
-
123
-
124
-
125
-
126
-
127
-
128
-
129
-
130
-
131
-
132
-
133
-
134
-
135
-
136
-
137
-
138
-
139
-
140
-
141
-
142
-
143
-
144
-
145
-
146
-
147
-
148
-
149
-
150
-
151
-
152
-
153
-
154
-
155
-
156
-
157
-
158
-
159
-
160
-
161
-
162
-
163
-
164
-
165
-
166
-
167
-
168
-
169
-
170
-
171
-
172
-
173
-
174
-
175
-
176
-
177
-
178
-
179
-
180
-
181
-
182
-
183
-
184
-
185
-
186
-
187
-
188
-
189
-
190
-
191
-
192
-
193
-
194
-
195
-
196
-
197
-
198
-
199
-
200
-
201
-
202
-
203
-
204
-
205
-
206
-
207
-
208
-
209
-
210
-
211
-
212
-
213
-
214
-
215
 |
 |

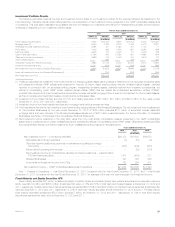
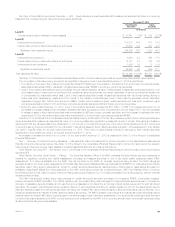
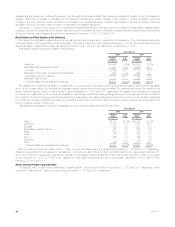
ABS. Our ABS are diversified both by collateral type and by issuer. The following table presents information about our ABS holdings at:
December 31,
2012 2011
Estimated
Fair
Value %of
Total
Net
Unrealized
Gains (Losses)
Estimated
Fair
Value %of
Total
Net
Unrealized
Gains (Losses)
(In millions) (In millions) (In millions) (In millions)
By collateral type:
Foreign residential loans ....................................... $ 3,811 23.8% $ 88 $ 1,771 13.7% $ (31)
Credit card loans ............................................. 2,640 16.5 106 4,038 31.1 141
Student loans ............................................... 2,480 15.5 14 2,434 18.8 (30)
Automobile loans ............................................. 2,454 15.4 28 977 7.5 5
Collateralized debt obligations ................................... 2,453 15.3 (68) 2,575 19.8 (163)
Equipment loans ............................................. 597 3.7 22 330 2.5 31
Other loans ................................................. 1,562 9.8 45 854 6.6 8
Total ..................................................... $15,997 100.0% $235 $12,979 100.0% $ (39)
Ratings profile:
Rated Aaa/AAA .............................................. $10,405 65.0% $ 8,223 63.4%
Rated NAIC 1 ............................................... $15,247 95.3% $12,507 96.4%
Evaluation of AFS Securities for OTTI and Evaluating Temporarily Impaired AFS Securities. See Notes 1 and 8 of the Notes to the Consolidated
Financial Statements for information about the evaluation of fixed maturity securities and equity securities AFS for OTTI and evaluation of temporarily
impaired AFS securities.
OTTI Losses on Fixed Maturity and Equity Securities AFS Recognized in Earnings
See Note 8 of the Notes to the Consolidated Financial Statements for information about OTTI losses and gross gains and gross losses on AFS
securities sold.
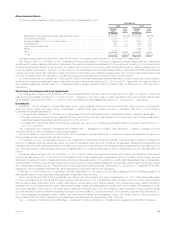
Overview of Fixed Maturity and Equity Security OTTI Losses Recognized in Earnings. Impairments of fixed maturity and equity securities were
$351 million, $1.0 billion and $484 million for the years ended December 31, 2012, 2011 and 2010, respectively. Impairments of fixed maturity
securities were $317 million, $955 million and $470 million for the years ended December 31, 2012, 2011 and 2010, respectively. Impairments of
equity securities were $34 million, $60 million and $14 million for the years ended December 31, 2012, 2011 and 2010, respectively.
Credit-related impairments of fixed maturity securities were $223 million, $645 million and $423 million for the years ended December 31, 2012,
2011 and 2010, respectively.
Explanations of changes in fixed maturity and equity securities impairments are as follows:
‰Year Ended December 31, 2012 compared to the Year Ended December 31, 2011 — Overall OTTI losses recognized in earnings on fixed
maturity and equity securities were $351 million for the current year as compared to $1.0 billion in the prior year. The most significant decrease in
the current period, as compared to the prior period, was in foreign government securities primarily attributable to prior year impairments on Greece
sovereign debt securities of $405 million as a result of the reduction in the expected recoverable amount (see “— Investments — Current
Environment”) and intent-to-sell fixed maturity security OTTI on other sovereign debt securities due to the repositioning of the acquired ALICO
portfolio into longer duration and higher yielding investments, resulting in total sovereign debt securities impairments of $486 million recognized in
2011. In addition, intent-to-sell OTTI related to the Divested Businesses of $154 million were recognized in 2011 primarily concentrated in the
RMBS sector, while utility industry impairments within U.S. and foreign corporate securities increased $51 million in the current year.
‰Year Ended December 31, 2011 compared to the Year Ended December 31, 2010 — Overall OTTI losses recognized in earnings on fixed
maturity and equity securities were $1.0 billion for the current year as compared to $484 million in the prior year. The increase in OTTI losses on
fixed maturity and equity securities primarily reflects impairments on Greece sovereign debt securities, repositioning of the acquired ALICO
portfolio, and impairments related to Divested Businesses, as discussed above. These increased impairments were partially offset by decreased
impairments in the CMBS, ABS and corporate sectors, reflecting improving economic fundamentals.
Future Impairments. Future OTTIs will depend primarily on economic fundamentals, issuer performance (including changes in the present value of
future cash flows expected to be collected), changes in credit ratings, changes in collateral valuation, changes in interest rates and changes in credit
spreads. If economic fundamentals or certain of the above factors deteriorate, additional OTTIs may be incurred in upcoming periods.
FVO and Trading Securities
FVO and trading securities are primarily comprised of securities for which the FVO has been elected (“FVO Securities”). FVO Securities include
certain fixed maturity and equity securities held for investment by the general account to support asset and liability matching strategies for certain
insurance products. FVO Securities are primarily comprised of contractholder-directed investments supporting unit-linked variable annuity type liabilities
which do not qualify for presentation as separate account summary total assets and liabilities. These investments are primarily mutual funds and, to a
lesser extent, fixed maturity and equity securities, short-term investments and cash and cash equivalents. The investment returns on these investments
inure to contractholders and are offset by a corresponding change in PABs through interest credited to policyholder account balances. FVO Securities
also include securities held by CSEs (former qualifying special purpose entities). We have a trading securities portfolio, principally invested in fixed
maturity securities, to support investment strategies that involve the active and frequent purchase and sale of actively traded securities and the execution
of short sale agreements. FVO and trading securities were $16.3 billion and $18.3 billion at estimated fair value, or 3.1% and 3.5% of total cash and
invested assets, at December 31, 2012 and 2011, respectively. See Note 10 of the Notes to the Consolidated Financial Statements for the FVO and
trading securities fair value hierarchy and a rollforward of the fair value measurements for FVO and trading securities measured at estimated fair value on
a recurring basis using significant unobservable (Level 3) inputs.
MetLife, Inc. 43