MetLife 2012 Annual Report Download - page 52
Download and view the complete annual report
Please find page 52 of the 2012 MetLife annual report below. You can navigate through the pages in the report by either clicking on the pages listed below, or by using the keyword search tool below to find specific information within the annual report.-
 1
1 -
2
-
3
-
4
-
5
-
6
-
7
-
8
-
9
-
10
-
11
-
12
-
13
-
14
-
15
-
16
-
17
-
18
-
19
-
20
-
21
-
22
-
23
-
24
-
25
-
26
-
27
-
28
-
29
-
30
-
31
-
32
-
33
-
34
-
35
-
36
-
37
-
38
-
39
-
40
-
41
-
 42
42 -
 43
43 -
 44
44 -
 45
45 -
 46
46 -
 47
47 -
 48
48 -
 49
49 -
 50
50 -
 51
51 -
 52
52 -
 53
53 -
 54
54 -
 55
55 -
 56
56 -
 57
57 -
 58
58 -
 59
59 -
 60
60 -
 61
61 -
 62
62 -
63
-
64
-
65
-
66
-
67
-
68
-
69
-
70
-
71
-
72
-
73
-
74
-
75
-
76
-
77
-
78
-
79
-
80
-
81
-
82
-
83
-
84
-
85
-
86
-
87
-
88
-
89
-
90
-
91
-
92
-
93
-
94
-
95
-
96
-
97
-
98
-
99
-
100
-
101
-
102
-
103
-
104
-
105
-
106
-
107
-
108
-
109
-
110
-
111
-
112
-
113
-
114
-
115
-
116
-
117
-
118
-
119
-
120
-
121
-
122
-
123
-
124
-
125
-
126
-
127
-
128
-
129
-
130
-
131
-
132
-
133
-
134
-
135
-
136
-
137
-
138
-
139
-
140
-
141
-
142
-
143
-
144
-
145
-
146
-
147
-
148
-
149
-
150
-
151
-
152
-
153
-
154
-
155
-
156
-
157
-
158
-
159
-
160
-
161
-
162
-
163
-
164
-
165
-
166
-
167
-
168
-
169
-
170
-
171
-
172
-
173
-
174
-
175
-
176
-
177
-
178
-
179
-
180
-
181
-
182
-
183
-
184
-
185
-
186
-
187
-
188
-
189
-
190
-
191
-
192
-
193
-
194
-
195
-
196
-
197
-
198
-
199
-
200
-
201
-
202
-
203
-
204
-
205
-
206
-
207
-
208
-
209
-
210
-
211
-
212
-
213
-
214
-
215
 |
 |

assessments are revised as conditions change and new information becomes available. We update our evaluations regularly, which can cause the
valuation allowances to increase or decrease over time as such evaluations are revised. Negative credit migration, including an actual or expected
increase in the level of problem loans, will result in an increase in the valuation allowance. Positive credit migration, including an actual or expected
decrease in the level of problem loans, will result in a decrease in the valuation allowance.
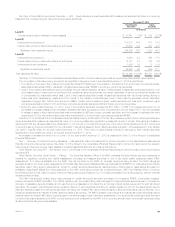
See Notes 1, 8 and 10 of the Notes to the Consolidated Financial Statements for information about how valuation allowances are established and
monitored, activity in and balances of the valuation allowance, and the estimated fair value of impaired mortgage loans and related impairments included
within net investment gains (losses) as of and for the years ended December 31, 2012, 2011 and 2010.
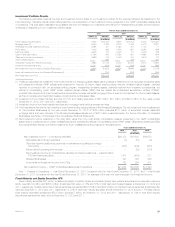
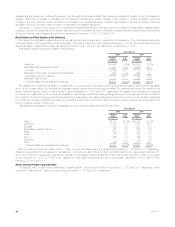
Real Estate and Real Estate Joint Ventures
We diversify our real estate investments by both geographic region and property type to reduce risk of concentration. Of our real estate investments,
83% were located in the United States, with the remaining 17% located outside the United States, at December 31, 2012. The three locations with the
largest real estate investments were California, Japan and Florida at 20%, 14%, and 11%, respectively, at December 31, 2012.
Real estate investments by type consisted of the following:
December 31,
2012 2011
Carrying
Value %of
Total Carrying
Value %of
Total
(In millions) (In millions)
Traditional .......................................................... $8,488 85.6% $5,836 68.2%
Real estate joint ventures and funds ...................................... 941 9.5 2,340 27.3
Subtotal .......................................................... 9,429 95.1 8,176 95.5
Foreclosed (commercial, agricultural and residential) ......................... 488 4.9 264 3.1
Real estate held-for-investment ........................................ 9,917 100.0 8,440 98.6
Real estate held-for-sale ............................................... 1 — 123 1.4
Total real estate and real estate joint ventures ............................. $9,918 100.0% $8,563 100.0%
We classify within traditional real estate our investment in income-producing real estate, which is comprised primarily of wholly-owned real estate
and, to a much lesser extent, joint ventures with interests in single property income-producing real estate. The estimated fair value of the traditional real
estate investment portfolio was $10.7 billion and $7.6 billion at December 31, 2012 and 2011, respectively. We classify within real estate joint ventures
and funds, our investments in joint ventures with interests in multi-property projects with varying strategies ranging from the development of properties to
the operation of income-producing properties, as well as our investments in real estate private equity funds. From time to time, we transfer investments
from these joint ventures to traditional real estate, if we retain an interest in the joint venture after a completed property commences operations andwe
intend to retain an interest in the property.
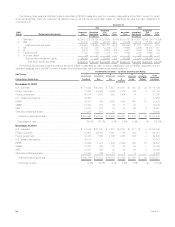
Real estate and real estate joint venture investments by property type are categorized by sector as follows:
December 31,
2012 2011
Carrying
Value %of
Total Carrying
Value %of
Total
(In millions) (In millions)
Office .............................................................. $5,789 58.4% $5,089 59.4%
Apartment .......................................................... 1,717 17.3 1,610 18.8
Industrial ........................................................... 598 6.0 427 5.0
Real estate investment funds ............................................ 451 4.6 562 6.6
Retail .............................................................. 416 4.2 332 3.9
Hotel .............................................................. 372 3.7 218 2.5
Land .............................................................. 265 2.7 126 1.5
Agriculture .......................................................... 8 0.1 14 0.2
Other .............................................................. 302 3.0 185 2.1
Total real estate and real estate joint ventures .............................. $9,918 100.0% $8,563 100.0%
We committed to acquire $2.9 billion and $1.1 billion of equity real estate during the years ended December 31, 2012 and 2011, respectively.
Impairments recognized on real estate and real estate joint ventures were $20 million, $2 million and $49 million for the years ended December 31,
2012, 2011 and 2010, respectively. Depreciation expense on real estate investments was $168 million, $164 million and $151 million for the years
ended December 31, 2012, 2011 and 2010, respectively. Real estate investments are net of accumulated depreciation of $1.3 billion at both
December 31, 2012 and 2011.
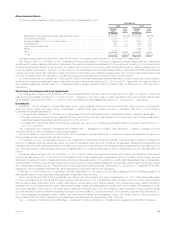
Other Limited Partnership Interests
The carrying value of other limited partnership interests was $6.7 billion and $6.4 billion at December 31, 2012 and 2011 respectively, which
included $1.4 billion and $1.1 billion of hedge funds, at December 31, 2012 and 2011, respectively.
46 MetLife, Inc.