MetLife 2012 Annual Report Download - page 191
Download and view the complete annual report
Please find page 191 of the 2012 MetLife annual report below. You can navigate through the pages in the report by either clicking on the pages listed below, or by using the keyword search tool below to find specific information within the annual report.-
 1
1 -
2
-
3
-
4
-
5
-
6
-
7
-
8
-
9
-
10
-
11
-
12
-
13
-
14
-
15
-
16
-
17
-
18
-
19
-
20
-
21
-
22
-
23
-
24
-
25
-
26
-
27
-
28
-
29
-
30
-
31
-
32
-
33
-
34
-
35
-
36
-
37
-
38
-
39
-
40
-
41
-
42
-
43
-
44
-
45
-
46
-
47
-
48
-
49
-
50
-
51
-
52
-
53
-
54
-
55
-
56
-
57
-
58
-
59
-
60
-
61
-
62
-
63
-
64
-
65
-
66
-
67
-
68
-
69
-
70
-
71
-
72
-
73
-
74
-
75
-
76
-
77
-
78
-
79
-
80
-
81
-
82
-
83
-
84
-
85
-
86
-
87
-
88
-
89
-
90
-
91
-
92
-
93
-
94
-
95
-
96
-
97
-
98
-
99
-
100
-
101
-
102
-
103
-
104
-
105
-
106
-
107
-
108
-
109
-
110
-
111
-
112
-
113
-
114
-
115
-
116
-
117
-
118
-
119
-
120
-
121
-
122
-
123
-
124
-
125
-
126
-
127
-
128
-
129
-
130
-
131
-
132
-
133
-
134
-
135
-
136
-
137
-
138
-
139
-
140
-
141
-
142
-
143
-
144
-
145
-
146
-
147
-
148
-
149
-
150
-
151
-
152
-
153
-
154
-
155
-
156
-
157
-
158
-
159
-
160
-
161
-
162
-
163
-
164
-
165
-
166
-
167
-
168
-
169
-
170
-
171
-
172
-
173
-
174
-
175
-
176
-
177
-
178
-
179
-
180
-
 181
181 -
 182
182 -
 183
183 -
 184
184 -
 185
185 -
 186
186 -
 187
187 -
 188
188 -
 189
189 -
 190
190 -
 191
191 -
 192
192 -
 193
193 -
 194
194 -
 195
195 -
 196
196 -
 197
197 -
 198
198 -
 199
199 -
 200
200 -
 201
201 -
202
-
203
-
204
-
205
-
206
-
207
-
208
-
209
-
210
-
211
-
212
-
213
-
214
-
215
 |
 |

MetLife, Inc.
Notes to the Consolidated Financial Statements — (Continued)
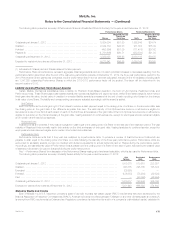
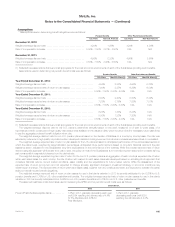
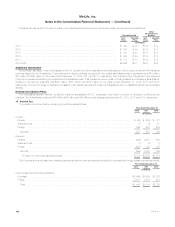
Assumptions
Assumptions used in determining benefit obligations were as follows:
Pension Benefits Other Postretirement Benefits
U.S. Plans Non-U.S. Plans (1) U.S. Plans Non-U.S. Plans (1)
December 31, 2012:
Weighted average discount rate ............................... 4.20% 1.98% 4.20% 4.94%
Rate of compensation increase ............................... 3.50% - 7.50% 2.01% - 5.50% N/A N/A
December 31, 2011:
Weighted average discount rate ............................... 4.95% 2.33% 4.95% 5.60%
Rate of compensation increase ............................... 3.50% - 7.50% 2.40% - 5.50% N/A N/A
(1) Reflects those assumptions that were most appropriate for the local economic environments of each of the Subsidiaries providing such benefits.
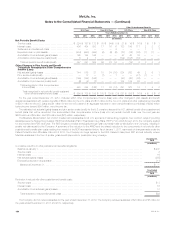
Assumptions used in determining net periodic benefit costs were as follows:
Pension Benefits Other Postretirement Benefits
U.S. Plans Non-U.S. Plans (1) U.S. Plans Non-U.S. Plans (1)
Year Ended December 31, 2012:
Weighted average discount rate ....................................... 4.95% 2.35% 4.95% 5.78%
Weighted average expected rate of return on plan assets ................... 7.00% 3.35% 6.26% 6.54%
Rate of compensation increase ........................................ 3.50% - 7.50% 2.00% - 4.00% N/A N/A
Year Ended December 31, 2011:
Weighted average discount rate ....................................... 5.80% 2.40% 5.80% 6.34%
Weighted average expected rate of return on plan assets ................... 7.25% 3.19% 7.25% 7.01%
Rate of compensation increase ........................................ 3.50% - 7.50% 3.00% - 5.50% N/A N/A
Year Ended December 31, 2010:
Weighted average discount rate ....................................... 6.25% 1.76% 6.25% N/A
Weighted average expected rate of return on plan assets ................... 8.00% 1.32% 7.20% N/A
Rate of compensation increase ........................................ 3.50% - 7.50% 2.00% - 4.00% N/A N/A
(1) Reflects those assumptions that were most appropriate for the local economic environments of each of the Subsidiaries providing such benefits.
The weighted average discount rate for the U.S. plans is determined annually based on the yield, measured on a yield to worst basis, of a
hypothetical portfolio constructed of high quality debt instruments available on the valuation date, which would provide the necessary future cash flows
to pay the aggregate projected benefit obligation when due.
The weighted average discount rate for non-U.S. pension plans is based on the duration of liabilities on a country by country basis. The rate was
selected by reference to high quality corporate bonds in developed markets or local government bonds where markets were less robust or nonexistent.
The weighted average expected rate of return on plan assets for the U.S. plans is based on anticipated performance of the various asset sectors in
which the plans invest, weighted by target allocation percentages. Anticipated future performance is based on long-term historical returns of the plan
assets by sector, adjusted for the Subsidiaries’ long-term expectations on the performance of the markets. While the precise expected rate of return
derived using this approach will fluctuate from year to year, the policy of most of the Subsidiaries’ is to hold this long-term assumption constant as long
as it remains within reasonable tolerance from the derived rate.
The weighted average expected long-term rate of return for the non-U.S. pension plans is an aggregation of each country’s expected rate of return
within each asset class. For each country, the rate of return with respect to each asset class was developed based on a building block approach that
considers historical returns, current market conditions, asset volatility and the expectations for future market returns. While the assessment of the
expected rate of return is long-term and not expected to change annually, significant changes in investment strategy or economic conditions may
warrant such a change. The expected rate of return within each asset class, together with any contributions made, are expected to maintain the plans’
ability to meet all required benefit obligations.
The weighted average expected rate of return on plan assets for use in that plan’s valuation in 2013 is currently anticipated to be 6.25% for U.S.
pension benefits and 5.75% for U.S. other postretirement benefits. The weighted average expected rate of return on plan assets for use in that plan’s
valuation in 2013 is currently anticipated to be 2.94% for non-U.S. pension benefits and 5.75% for non-U.S. other postretirement benefits.
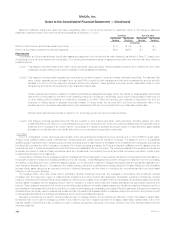
The assumed healthcare costs trend rates used in measuring the APBO and net periodic benefit costs were as follows:
December 31,
2012 2011
Pre-and Post-Medicare eligible claims .......... 7.8% in 2013, gradually decreasing each year
until 2094 reaching the ultimate rate of 4.4%
for Pre-Medicare and 4.6% for
Post-Medicare.
7.3% in 2012, gradually
decreasing each year until 2083
reaching the ultimate rate of 4.3%.
MetLife, Inc. 185