MetLife 2012 Annual Report Download - page 179
Download and view the complete annual report
Please find page 179 of the 2012 MetLife annual report below. You can navigate through the pages in the report by either clicking on the pages listed below, or by using the keyword search tool below to find specific information within the annual report.-
 1
1 -
2
-
3
-
4
-
5
-
6
-
7
-
8
-
9
-
10
-
11
-
12
-
13
-
14
-
15
-
16
-
17
-
18
-
19
-
20
-
21
-
22
-
23
-
24
-
25
-
26
-
27
-
28
-
29
-
30
-
31
-
32
-
33
-
34
-
35
-
36
-
37
-
38
-
39
-
40
-
41
-
42
-
43
-
44
-
45
-
46
-
47
-
48
-
49
-
50
-
51
-
52
-
53
-
54
-
55
-
56
-
57
-
58
-
59
-
60
-
61
-
62
-
63
-
64
-
65
-
66
-
67
-
68
-
69
-
70
-
71
-
72
-
73
-
74
-
75
-
76
-
77
-
78
-
79
-
80
-
81
-
82
-
83
-
84
-
85
-
86
-
87
-
88
-
89
-
90
-
91
-
92
-
93
-
94
-
95
-
96
-
97
-
98
-
99
-
100
-
101
-
102
-
103
-
104
-
105
-
106
-
107
-
108
-
109
-
110
-
111
-
112
-
113
-
114
-
115
-
116
-
117
-
118
-
119
-
120
-
121
-
122
-
123
-
124
-
125
-
126
-
127
-
128
-
129
-
130
-
131
-
132
-
133
-
134
-
135
-
136
-
137
-
138
-
139
-
140
-
141
-
142
-
143
-
144
-
145
-
146
-
147
-
148
-
149
-
150
-
151
-
152
-
153
-
154
-
155
-
156
-
157
-
158
-
159
-
160
-
161
-
162
-
163
-
164
-
165
-
166
-
167
-
168
-
 169
169 -
 170
170 -
 171
171 -
 172
172 -
 173
173 -
 174
174 -
 175
175 -
 176
176 -
 177
177 -
 178
178 -
 179
179 -
 180
180 -
 181
181 -
 182
182 -
 183
183 -
 184
184 -
 185
185 -
 186
186 -
 187
187 -
 188
188 -
 189
189 -
190
-
191
-
192
-
193
-
194
-
195
-
196
-
197
-
198
-
199
-
200
-
201
-
202
-
203
-
204
-
205
-
206
-
207
-
208
-
209
-
210
-
211
-
212
-
213
-
214
-
215
 |
 |

MetLife, Inc.
Notes to the Consolidated Financial Statements — (Continued)
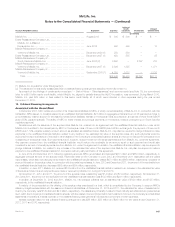
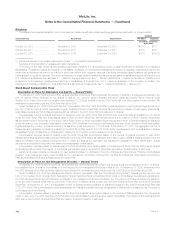
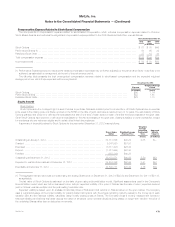
Compensation Expense Related to Stock-Based Compensation
The components of compensation expense related to stock-based compensation which includes compensation expense related to Phantom
Stock-Based Awards, and excludes the insignificant compensation expense related to the 2005 Directors Stock Plan, were as follows:
Years Ended December 31,
2012 2011 2010
(In millions)
Stock Options ........................................................................................ $ 61 $ 58 $45
Performance Shares (1) ................................................................................. 80 68 29
Restricted Stock Units .................................................................................. 27 18 10
Total compensation expense ............................................................................. $168 $144 $84
Income tax benefit ..................................................................................... $ 59 $ 50 $29
(1) Performance Shares expected to vest and the related compensation expenses may be further adjusted by the performance factor most likely to be
achieved, as estimated by management, at the end of the performance period.
The following table presents the total unrecognized compensation expense related to stock-based compensation and the expected weighted
average period over which these expenses will be recognized at:
December 31, 2012
Expense Weighted Average
Period
(In millions) (Years)
Stock Options ................................................................................. $56 1.74
Performance Shares ............................................................................ $52 1.65
Restricted Stock Units ........................................................................... $28 1.73
Equity Awards
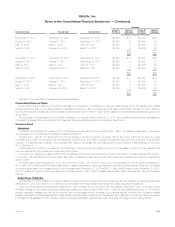
Stock Options
Stock Options are the contingent right of award holders to purchase Shares at a stated price for a limited time. All Stock Options have an exercise
price equal to the closing price of a Share reported on the NYSE on the date of grant, and have a maximum term of 10 years. The vast majority of Stock
Options granted have become or will become exercisable at a rate of one-third of each award on each of the first three anniversaries of the grant date.
Other Stock Options have become or will become exercisable on the third anniversary of the grant date. Vesting is subject to continued service, except
for employees who are retirement eligible and in certain other limited circumstances.
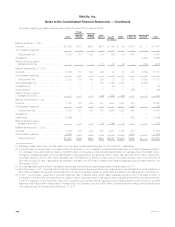
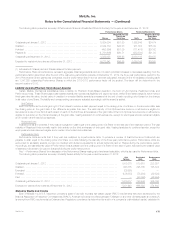
A summary of the activity related to Stock Options for the year ended December 31, 2012 was as follows:
Shares Under
Option Weighted Average
Exercise Price
Weighted
Average
Remaining
Contractual
Term
Aggregate
Intrinsic
Value (1)
(Years) (In millions)
Outstanding at January 1, 2012 ............................................... 34,713,526 $40.22 5.35 $ —
Granted ................................................................. 6,247,050 $37.91
Exercised ................................................................ (3,817,301) $28.44
Expired .................................................................. (1,017,994) $47.35
Forfeited ................................................................. (972,210) $40.23
Outstanding at December 31, 2012 ........................................... 35,153,071 $40.89 5.50 $51
Expected to vest at a future date as of December 31, 2012 ......................... 34,684,396 $40.94 5.41 $51
Exercisable at December 31, 2012 ............................................ 24,530,711 $41.36 4.16 $50
(1) The aggregate intrinsic value was computed using the closing Share price on December 31, 2012 of $32.94 and December 30, 2011 of $31.18,
as applicable.
The fair value of Stock Options is estimated on the date of grant using a binomial lattice model. Significant assumptions used in the Company’s
binomial lattice model, which are further described below, include: expected volatility of the price of Shares; risk-free rate of return; expected dividend
yield on Shares; exercise multiple; and the post-vesting termination rate.
Expected volatility is based upon an analysis of historical prices of Shares and call options on Shares traded on the open market. The Company
uses a weighted-average of the implied volatility for publicly-traded call options with the longest remaining maturity nearest to the money as of each
valuation date and the historical volatility, calculated using monthly closing prices of Shares. The Company chose a monthly measurement interval for
historical volatility as it believes this better depicts the nature of employee option exercise decisions being based on longer-term trends in the price of
the underlying Shares rather than on daily price movements.
MetLife, Inc. 173