MetLife 2012 Annual Report Download - page 78
Download and view the complete annual report
Please find page 78 of the 2012 MetLife annual report below. You can navigate through the pages in the report by either clicking on the pages listed below, or by using the keyword search tool below to find specific information within the annual report.-
 1
1 -
2
-
3
-
4
-
5
-
6
-
7
-
8
-
9
-
10
-
11
-
12
-
13
-
14
-
15
-
16
-
17
-
18
-
19
-
20
-
21
-
22
-
23
-
24
-
25
-
26
-
27
-
28
-
29
-
30
-
31
-
32
-
33
-
34
-
35
-
36
-
37
-
38
-
39
-
40
-
41
-
42
-
43
-
44
-
45
-
46
-
47
-
48
-
49
-
50
-
51
-
52
-
53
-
54
-
55
-
56
-
57
-
58
-
59
-
60
-
61
-
62
-
63
-
64
-
65
-
66
-
67
-
 68
68 -
 69
69 -
 70
70 -
 71
71 -
 72
72 -
 73
73 -
 74
74 -
 75
75 -
 76
76 -
 77
77 -
 78
78 -
 79
79 -
 80
80 -
 81
81 -
 82
82 -
 83
83 -
 84
84 -
 85
85 -
 86
86 -
 87
87 -
 88
88 -
89
-
90
-
91
-
92
-
93
-
94
-
95
-
96
-
97
-
98
-
99
-
100
-
101
-
102
-
103
-
104
-
105
-
106
-
107
-
108
-
109
-
110
-
111
-
112
-
113
-
114
-
115
-
116
-
117
-
118
-
119
-
120
-
121
-
122
-
123
-
124
-
125
-
126
-
127
-
128
-
129
-
130
-
131
-
132
-
133
-
134
-
135
-
136
-
137
-
138
-
139
-
140
-
141
-
142
-
143
-
144
-
145
-
146
-
147
-
148
-
149
-
150
-
151
-
152
-
153
-
154
-
155
-
156
-
157
-
158
-
159
-
160
-
161
-
162
-
163
-
164
-
165
-
166
-
167
-
168
-
169
-
170
-
171
-
172
-
173
-
174
-
175
-
176
-
177
-
178
-
179
-
180
-
181
-
182
-
183
-
184
-
185
-
186
-
187
-
188
-
189
-
190
-
191
-
192
-
193
-
194
-
195
-
196
-
197
-
198
-
199
-
200
-
201
-
202
-
203
-
204
-
205
-
206
-
207
-
208
-
209
-
210
-
211
-
212
-
213
-
214
-
215
 |
 |

Foreign currency exchange rate risk increased by $1.6 billion, to $6.6 billion at December 31, 2012 from $5.0 billion at December 31, 2011. This
change was due to an increase in exchange rate risk relating to fixed maturity securities and equity securities (including FVO and trading securities),
mortgage loans, cash and cash equivalents, other invested assets, net embedded derivatives within liability host contracts and PABs. Our exposure
increased primarily due to the Australian dollar and the Japanese yen.
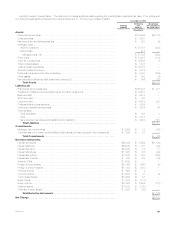
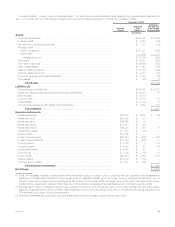
Sensitivity Analysis: Equity Market Prices. The table below provides additional detail regarding the potential loss in estimated fair value of our
portfolio due to a 10% change in equity at December 31, 2012 by type of asset or liability:
December 31, 2012
Notional
Amount
Estimated
Fair
Value (1)
Assuming a
10% Increase
in Equity
Prices
(In millions)
Assets:
Equity securities .......................................................................... $ 2,891 $ 258
Net embedded derivatives within asset host contracts (2) ......................................... $ 506 (25)
Total Assets ......................................................................... 233
Liabilities:
Policyholder account balances .............................................................. $150,497 —
Bank deposits ........................................................................... $ 6,416 —
Net embedded derivatives within liability host contracts (2) ......................................... $ 3,684 802
Total Liabilities ....................................................................... $ 802
Derivative Instruments:
Interest rate swaps ....................................................................... $92,289 $ 5,694 $ —
Interest rate floors ........................................................................ $56,246 $ 337 —
Interest rate caps ......................................................................... $49,465 $ 74 —
Interest rate futures ....................................................................... $11,684 $ (37) —
Interest rate options ....................................................................... $16,328 $ 580 —
Interest rate forwards ...................................................................... $ 675 $ 139 —
Synthetic GICs ........................................................................... $ 4,162 $ — —
Foreign currency swaps ................................................................... $20,433 $ (426) —
Foreign currency forwards .................................................................. $11,754 $ (280) —
Currency futures ......................................................................... $ 1,408 $ 4 —
Currency options ......................................................................... $ 4,504 $ 41 —
Credit default swaps ...................................................................... $12,553 $ 51 —
Equity futures ............................................................................ $ 7,008 $ (118) (620)
Equity options ........................................................................... $22,920 $ 2,469 (440)
Variance swaps .......................................................................... $19,830 $ (188) 14
Total rate of return swaps .................................................................. $ 3,092 $ (99) (308)
Total Derivative Instruments ........................................................... $(1,354)
Net Change .............................................................................. $ (319)
(1) Does not necessarily represent those financial instruments solely subject to equity price risk. Additionally, separate account assets and liabilities
and contractholder-directed unit-linked investments and associated PABs, which are equity market sensitive, are not included herein as any equity
market risk is borne by the contractholder.
(2) Embedded derivatives are recognized in the consolidated balance sheet in the same caption as the host contract.
Equity price risk increased by $282 million to $319 million at December 31, 2012 from $37 million at December 31, 2011. This increase is primarily
due to a change in the portfolio composition of derivatives we employ.
72 MetLife, Inc.