MetLife 2012 Annual Report Download - page 113
Download and view the complete annual report
Please find page 113 of the 2012 MetLife annual report below. You can navigate through the pages in the report by either clicking on the pages listed below, or by using the keyword search tool below to find specific information within the annual report.-
 1
1 -
2
-
3
-
4
-
5
-
6
-
7
-
8
-
9
-
10
-
11
-
12
-
13
-
14
-
15
-
16
-
17
-
18
-
19
-
20
-
21
-
22
-
23
-
24
-
25
-
26
-
27
-
28
-
29
-
30
-
31
-
32
-
33
-
34
-
35
-
36
-
37
-
38
-
39
-
40
-
41
-
42
-
43
-
44
-
45
-
46
-
47
-
48
-
49
-
50
-
51
-
52
-
53
-
54
-
55
-
56
-
57
-
58
-
59
-
60
-
61
-
62
-
63
-
64
-
65
-
66
-
67
-
68
-
69
-
70
-
71
-
72
-
73
-
74
-
75
-
76
-
77
-
78
-
79
-
80
-
81
-
82
-
83
-
84
-
85
-
86
-
87
-
88
-
89
-
90
-
91
-
92
-
93
-
94
-
95
-
96
-
97
-
98
-
99
-
100
-
101
-
102
-
 103
103 -
 104
104 -
 105
105 -
 106
106 -
 107
107 -
 108
108 -
 109
109 -
 110
110 -
 111
111 -
 112
112 -
 113
113 -
 114
114 -
 115
115 -
 116
116 -
 117
117 -
 118
118 -
 119
119 -
 120
120 -
 121
121 -
 122
122 -
 123
123 -
124
-
125
-
126
-
127
-
128
-
129
-
130
-
131
-
132
-
133
-
134
-
135
-
136
-
137
-
138
-
139
-
140
-
141
-
142
-
143
-
144
-
145
-
146
-
147
-
148
-
149
-
150
-
151
-
152
-
153
-
154
-
155
-
156
-
157
-
158
-
159
-
160
-
161
-
162
-
163
-
164
-
165
-
166
-
167
-
168
-
169
-
170
-
171
-
172
-
173
-
174
-
175
-
176
-
177
-
178
-
179
-
180
-
181
-
182
-
183
-
184
-
185
-
186
-
187
-
188
-
189
-
190
-
191
-
192
-
193
-
194
-
195
-
196
-
197
-
198
-
199
-
200
-
201
-
202
-
203
-
204
-
205
-
206
-
207
-
208
-
209
-
210
-
211
-
212
-
213
-
214
-
215
 |
 |

MetLife, Inc.
Notes to the Consolidated Financial Statements — (Continued)
December 31,
2012 2011
(In millions)
FHLB of NY ................................................................................................. $736 $658
FHLB of Des Moines .......................................................................................... $ 83 $ 51
FHLB of Boston .............................................................................................. $ 67 $ 70
FHLB of Pittsburgh ........................................................................................... $ 14 N/A
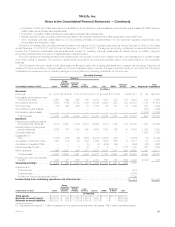
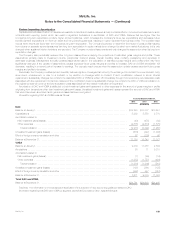
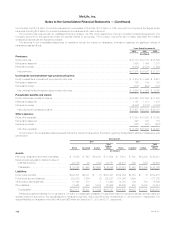
Such subsidiaries have also entered into funding agreements. The liability for funding agreements is included in PABs. Information related to the
funding agreements was as follows at:
Liability Collateral
December 31,
2012 2011 2012 2011
(In millions)
FHLB of NY(1) ...................................................................... $13,512 $11,655 $14,611 (2) $13,002 (2)
Farmer Mac(3) ...................................................................... $ 2,750 $ 2,750 $ 3,159 $ 3,157
FHLB of Des Moines(1) ............................................................... $ 1,405 $ 695 $ 1,902 (2) $ 953 (2)
FHLB of Boston(1) ................................................................... $ 450 $ 450 $ 537(2)$ 518(2)
FHLB of Pittsburgh ................................................................... $ — N/A $ 810(2) N/A
(1) Represents funding agreements issued to the FHLB in exchange for cash and for which the FHLB has been granted a lien on certain assets, some
of which are in the custody of the FHLB, including residential mortgage-backed securities (“RMBS”), to collateralize obligations under advances
evidenced by funding agreements. The Company is permitted to withdraw any portion of the collateral in the custody of the FHLB as long as there
is no event of default and the remaining qualified collateral is sufficient to satisfy the collateral maintenance level. Upon any event of default by the
Company, the FHLB’s recovery on the collateral is limited to the amount of the Company’s liability to the FHLB.
(2) Advances are collateralized by mortgage-backed securities. The amount of collateral presented is at estimated fair value.
(3) Represents funding agreements issued to certain SPEs that have issued debt securities for which payment of interest and principal is secured by
such funding agreements, and such debt securities are also guaranteed as to payment of interest and principal by the Federal Agricultural
Mortgage Corporation, a federally chartered instrumentality of the U.S. (“Farmer Mac”). The obligations under these funding agreements are
secured by a pledge of certain eligible agricultural real estate mortgage loans and may, under certain circumstances, be secured by other qualified
collateral. The amount of collateral presented is at carrying value.
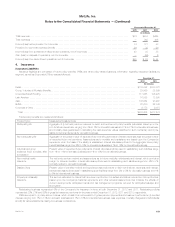
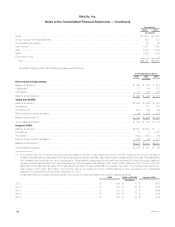
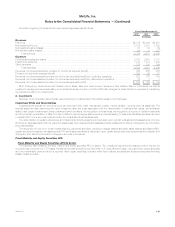
Liabilities for Unpaid Claims and Claim Expenses
Information regarding the liabilities for unpaid claims and claim expenses relating to property and casualty, group accident and non-medical health
policies and contracts, which are reported in future policy benefits and other policy-related balances, was as follows:
Years Ended December 31,
2012 2011 2010
(In millions)
Balance at January 1, ........................................................................... $10,117 $10,708 $ 8,219
Less: Reinsurance recoverables ................................................................. 1,436 2,198 547
Net balance at January 1, ....................................................................... 8,681 8,510 7,672
Acquisitions, net ............................................................................... — — 583
Incurred related to:
Current year ................................................................................ 8,399 9,028 6,482
Prior years .................................................................................. (69) (199) (75)
Total incurred ............................................................................. 8,330 8,829 6,407
Paid related to:
Current year ................................................................................ (5,689) (6,238) (4,050)
Prior years .................................................................................. (2,467) (2,420) (2,102)
Total paid ................................................................................ (8,156) (8,658) (6,152)
Net balance at December 31, .................................................................... 8,855 8,681 8,510
Add: Reinsurance recoverables ................................................................. 1,581 1,436 2,198
Balance at December 31, ....................................................................... $10,436 $10,117 $10,708
During 2012, 2011 and 2010, as a result of changes in estimates of insured events in the respective prior year, claims and claim adjustment
expenses associated with prior years decreased by $69 million, $199 million and $75 million, respectively, due to a reduction in prior year automobile
bodily injury and homeowners’ severity and improved loss ratio for non-medical health claim liabilities.
MetLife, Inc. 107