MetLife 2012 Annual Report Download - page 38
Download and view the complete annual report
Please find page 38 of the 2012 MetLife annual report below. You can navigate through the pages in the report by either clicking on the pages listed below, or by using the keyword search tool below to find specific information within the annual report.-
 1
1 -
2
-
3
-
4
-
5
-
6
-
7
-
8
-
9
-
10
-
11
-
12
-
13
-
14
-
15
-
16
-
17
-
18
-
19
-
20
-
21
-
22
-
23
-
24
-
25
-
26
-
27
-
 28
28 -
 29
29 -
 30
30 -
 31
31 -
 32
32 -
 33
33 -
 34
34 -
 35
35 -
 36
36 -
 37
37 -
 38
38 -
 39
39 -
 40
40 -
 41
41 -
 42
42 -
 43
43 -
 44
44 -
 45
45 -
 46
46 -
 47
47 -
 48
48 -
49
-
50
-
51
-
52
-
53
-
54
-
55
-
56
-
57
-
58
-
59
-
60
-
61
-
62
-
63
-
64
-
65
-
66
-
67
-
68
-
69
-
70
-
71
-
72
-
73
-
74
-
75
-
76
-
77
-
78
-
79
-
80
-
81
-
82
-
83
-
84
-
85
-
86
-
87
-
88
-
89
-
90
-
91
-
92
-
93
-
94
-
95
-
96
-
97
-
98
-
99
-
100
-
101
-
102
-
103
-
104
-
105
-
106
-
107
-
108
-
109
-
110
-
111
-
112
-
113
-
114
-
115
-
116
-
117
-
118
-
119
-
120
-
121
-
122
-
123
-
124
-
125
-
126
-
127
-
128
-
129
-
130
-
131
-
132
-
133
-
134
-
135
-
136
-
137
-
138
-
139
-
140
-
141
-
142
-
143
-
144
-
145
-
146
-
147
-
148
-
149
-
150
-
151
-
152
-
153
-
154
-
155
-
156
-
157
-
158
-
159
-
160
-
161
-
162
-
163
-
164
-
165
-
166
-
167
-
168
-
169
-
170
-
171
-
172
-
173
-
174
-
175
-
176
-
177
-
178
-
179
-
180
-
181
-
182
-
183
-
184
-
185
-
186
-
187
-
188
-
189
-
190
-
191
-
192
-
193
-
194
-
195
-
196
-
197
-
198
-
199
-
200
-
201
-
202
-
203
-
204
-
205
-
206
-
207
-
208
-
209
-
210
-
211
-
212
-
213
-
214
-
215
 |
 |

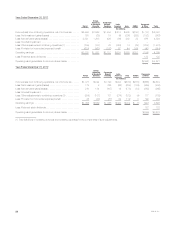
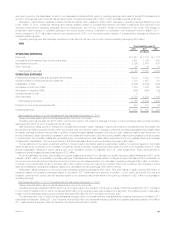
Sales results continued to show steady growth and improvement, with increases over 2010 in essentially all of our businesses. Strong variable
universal life sales and the launch of new accident & health products in Korea drove higher premiums and universal life fees over the prior year.
Premiums were lower compared to the prior year in Hong Kong due to a decline in life sales, and in Australia despite growth in group sales. An increase
in average invested assets generated higher net investment income and policy fees. Operating expenses increased primarily driven by higher
commissions and compensation expenses in Korea due to business growth, partially offset by an increase in DAC capitalization. DAC amortization also
increased due to business growth. As a result of the ALICO Acquisition and growth in the business, Asia’s results reflect higher corporate expenses of
$77 million, which decreased operating earnings.
Investment yields were negatively impacted by lower returns on allocated equity and a decrease in the results of our operating joint venture in China.
Beginning in the fourth quarter of 2010, investment earnings and interest credited related to contractholder-directed unit-linked investments were
excluded from operating revenues and operating expenses, as the contractholder, and not the Company, directs the investment of the funds. This
change in presentation had no impact on operating earnings in the current period; however, it resulted in a decrease in net investment income in Hong
Kong in 2011, when compared to 2010, as positive returns were experienced in 2010 from recovering equity markets. A corresponding decrease is
reflected in interest credited expense.
The impact of the sale of our operating joint venture in Japan on April 1, 2011 decreased operating results by $28 million, as no earnings were
recognized in 2011.
Unfavorable claims experience resulted in a $16 million decline in operating earnings over the prior period.
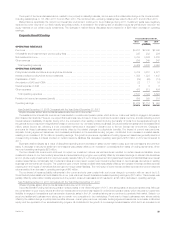
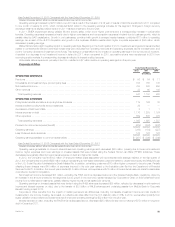
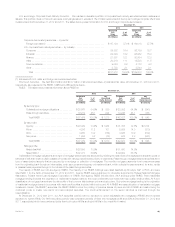
EMEA
Years Ended December 31,
2012 2011 2010
(In millions)
OPERATING REVENUES
Premiums ........................................................................................ $2,370 $2,477 $ 439
Universal life and investment-type product policy fees ...................................................... 333 315 50
Net investment income .............................................................................. 535 562 155
Other revenues .................................................................................... 121 123 9
Total operating revenues ........................................................................... 3,359 3,477 653
OPERATING EXPENSES
Policyholder benefits and claims and policyholder dividends ................................................. 1,196 1,290 137
Interest credited to policyholder account balances ......................................................... 126 166 124
Capitalization of DAC ............................................................................... (723) (669) (116)
Amortization of DAC and VOBA ....................................................................... 626 613 87
Amortization of negative VOBA ........................................................................ (94) (53) (7)
Interest expense on debt ............................................................................ 1 — 1
Other expenses ................................................................................... 1,810 1,723 434
Total operating expenses .......................................................................... 2,942 3,070 660
Provision for income tax expense (benefit) ............................................................... 146 156 —
Operating earnings ................................................................................. $ 271 $ 251 $ (7)
Year Ended December 31, 2012 Compared with the Year Ended December 31, 2011
Unless otherwise stated, all amounts discussed below are net of income tax.
Operating earnings increased by $20 million over 2011. The impact of changes in foreign currency exchange rates reduced operating earnings by
$23 million for 2012 compared to 2011 and resulted in significant variances in the financial statement line items. The fourth quarter 2011 purchase of a
Turkish life insurance and pension company and the third quarter 2012 acquisition of life insurance businesses in the Czech Republic, Hungary and
Romania from the members of the Aviva Plc group increased operating earnings by $15 million.
The segment continued to experience business growth; however, certain European countries in the region continued to be affected by the
challenging economic environment. Sales for all major product lines increased when compared to 2011 across all geographic regions. Retirement sales
were generated primarily by strong sales of variable annuity products in western Europe. Accident and health sales increased primarily due to the
establishment of a new direct marketing channel in the Middle East. Life insurance sales increased primarily due to variable life sales in the Middle East.
Credit life sales increased primarily due to sales in the Middle East and eastern and southern Europe resulting in higher premiums and policyholder
benefits. Operating expenses increased across all regions due to business growth, including higher lease expenses and payroll costs due to business
expansion in western Europe. The increased sales generated an increase in commissions, which was largely offset by related DAC capitalization. Fee
income increased largely due to higher sales of variable life products in central and western Europe. The combined impact of the items discussed
above reduced operating earnings by $24 million.
Operating earnings were negatively affected by lower net investment income of $56 million, primarily due to the disposal of certain closed blocks of
business in the U.K. and lower average invested assets as a result of dividends paid to MetLife, Inc. at the end of 2011.
Operating earnings increased $74 million reflecting higher investment yields. The increase in yields reflects higher returns on certain securities,
primarily in Poland, and higher returns on mutual fund investments, primarily in Greece (both driven by improving equity markets), as well as invested
asset growth in higher yielding markets including Egypt and the Ukraine.
Operating earnings benefited by $13 million primarily due to a release of negative VOBA associated with the conversion of certain policies, partially
offset by an adjustment related to additional liabilities for annuitants. In addition, income tax was lower in 2012 by $18 million primarily due to
permanently reinvested earnings in Poland.
32 MetLife, Inc.