MetLife 2012 Annual Report Download - page 136
Download and view the complete annual report
Please find page 136 of the 2012 MetLife annual report below. You can navigate through the pages in the report by either clicking on the pages listed below, or by using the keyword search tool below to find specific information within the annual report.-
 1
1 -
2
-
3
-
4
-
5
-
6
-
7
-
8
-
9
-
10
-
11
-
12
-
13
-
14
-
15
-
16
-
17
-
18
-
19
-
20
-
21
-
22
-
23
-
24
-
25
-
26
-
27
-
28
-
29
-
30
-
31
-
32
-
33
-
34
-
35
-
36
-
37
-
38
-
39
-
40
-
41
-
42
-
43
-
44
-
45
-
46
-
47
-
48
-
49
-
50
-
51
-
52
-
53
-
54
-
55
-
56
-
57
-
58
-
59
-
60
-
61
-
62
-
63
-
64
-
65
-
66
-
67
-
68
-
69
-
70
-
71
-
72
-
73
-
74
-
75
-
76
-
77
-
78
-
79
-
80
-
81
-
82
-
83
-
84
-
85
-
86
-
87
-
88
-
89
-
90
-
91
-
92
-
93
-
94
-
95
-
96
-
97
-
98
-
99
-
100
-
101
-
102
-
103
-
104
-
105
-
106
-
107
-
108
-
109
-
110
-
111
-
112
-
113
-
114
-
115
-
116
-
117
-
118
-
119
-
120
-
121
-
122
-
123
-
124
-
125
-
 126
126 -
 127
127 -
 128
128 -
 129
129 -
 130
130 -
 131
131 -
 132
132 -
 133
133 -
 134
134 -
 135
135 -
 136
136 -
 137
137 -
 138
138 -
 139
139 -
 140
140 -
 141
141 -
 142
142 -
 143
143 -
 144
144 -
 145
145 -
 146
146 -
147
-
148
-
149
-
150
-
151
-
152
-
153
-
154
-
155
-
156
-
157
-
158
-
159
-
160
-
161
-
162
-
163
-
164
-
165
-
166
-
167
-
168
-
169
-
170
-
171
-
172
-
173
-
174
-
175
-
176
-
177
-
178
-
179
-
180
-
181
-
182
-
183
-
184
-
185
-
186
-
187
-
188
-
189
-
190
-
191
-
192
-
193
-
194
-
195
-
196
-
197
-
198
-
199
-
200
-
201
-
202
-
203
-
204
-
205
-
206
-
207
-
208
-
209
-
210
-
211
-
212
-
213
-
214
-
215
 |
 |

MetLife, Inc.
Notes to the Consolidated Financial Statements — (Continued)
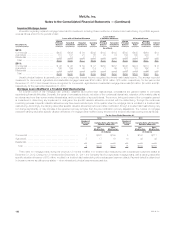
See “— Variable Interest Entities” for discussion of CSEs included in the table above.
Gains (losses) from foreign currency transactions included within net investment gains (losses) were ($112) million, $37 million and $230 million for
the years ended December 31, 2012, 2011 and 2010, respectively.
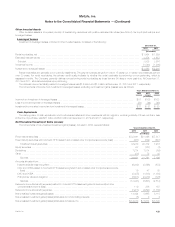
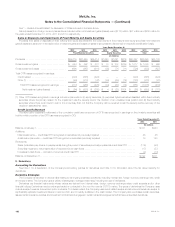
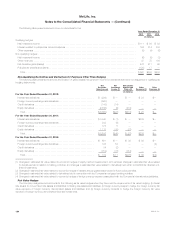
Sales or Disposals and Impairments of Fixed Maturity and Equity Securities
Proceeds from sales or disposals of fixed maturity and equity securities and the components of fixed maturity and equity securities net investment
gains (losses) are as shown in the table below. Investment gains and losses on sales of securities are determined on a specific identification basis.
Years Ended December 31,
2012 2011 2010 2012 2011 2010 2012 2011 2010
Fixed Maturity Securities Equity Securities Total
(In millions)
Proceeds ................................. $59,219 $67,449 $54,514 $1,648 $1,241 $616 $60,867 $68,690 $55,130
Gross investment gains ...................... $ 944 $ 892 $ 831 $ 73 $ 108 $129 $ 1,017 $ 1,000 $ 960
Gross investment losses ..................... (691) (867) (616) (35) (71) (11) (726) (938) (627)
Total OTTI losses recognized in earnings:
Credit-related ............................ (223) (645) (423) — — — (223) (645) (423)
Other (1) ................................ (94) (310) (47) (34) (60) (14) (128) (370) (61)
Total OTTI losses recognized in earnings ..... (317) (955) (470) (34) (60) (14) (351) (1,015) (484)
Net investment gains (losses) ............ $ (64) $ (930) $ (255) $ 4 $ (23) $104 $ (60) $ (953) $ (151)
(1) Other OTTI losses recognized in earnings include impairments on (i) equity securities, (ii) perpetual hybrid securities classified within fixed maturity
securities where the primary reason for the impairment was the severity and/or the duration of an unrealized loss position and (iii) fixed maturity
securities where there is an intent to sell or it is more likely than not that the Company will be required to sell the security before recovery of the
decline in estimated fair value.
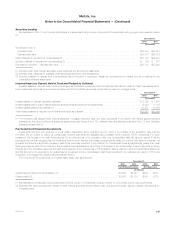
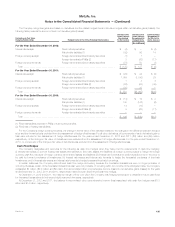
Credit Loss Rollforward
The table below presents a rollforward of the cumulative credit loss component of OTTI loss recognized in earnings on fixed maturity securities still
held for which a portion of the OTTI loss was recognized in OCI:
Years Ended December 31,
2012 2011
(In millions)
Balance, at January 1, ................................................................................. $471 $443
Additions:
Initial impairments — credit loss OTTI recognized on securities not previously impaired ............................. 46 45
Additional impairments — credit loss OTTI recognized on securities previously impaired ............................ 70 143
Reductions:
Sales (maturities, pay downs or prepayments) during the period of securities previously impaired as credit loss OTTI ...... (176) (90)
Securities impaired to net present value of expected future cash flows .......................................... (17) (57)
Increases in cash flows — accretion of previous credit loss OTTI .............................................. (2) (13)
Balance, at December 31, .............................................................................. $392 $471
9. Derivatives
Accounting for Derivatives
See Note 1 for a description of the Company’s accounting policies for derivatives and Note 10 for information about the fair value hierarchy for
derivatives.
Derivative Strategies
The Company is exposed to various risks relating to its ongoing business operations, including interest rate, foreign currency exchange rate, credit
and equity market. The Company uses a variety of strategies to manage these risks, including the use of derivatives.
Derivatives are financial instruments whose values are derived from interest rates, foreign currency exchange rates, credit spreads and/or other
financial indices. Derivatives may be exchange-traded or contracted in the over-the-counter (“OTC”) market. The types of derivatives the Company uses
include swaps, forwards, futures and option contracts. To a lesser extent, the Company uses credit default swaps and structured interest rate swaps to
synthetically replicate investment risks and returns which are not readily available in the cash market. The Company also purchases certain securities,
issues certain insurance policies and investment contracts and engages in certain reinsurance agreements that have embedded derivatives.
130 MetLife, Inc.