MetLife 2012 Annual Report Download - page 34
Download and view the complete annual report
Please find page 34 of the 2012 MetLife annual report below. You can navigate through the pages in the report by either clicking on the pages listed below, or by using the keyword search tool below to find specific information within the annual report.-
 1
1 -
2
-
3
-
4
-
5
-
6
-
7
-
8
-
9
-
10
-
11
-
12
-
13
-
14
-
15
-
16
-
17
-
18
-
19
-
20
-
21
-
22
-
23
-
 24
24 -
 25
25 -
 26
26 -
 27
27 -
 28
28 -
 29
29 -
 30
30 -
 31
31 -
 32
32 -
 33
33 -
 34
34 -
 35
35 -
 36
36 -
 37
37 -
 38
38 -
 39
39 -
 40
40 -
 41
41 -
 42
42 -
 43
43 -
 44
44 -
45
-
46
-
47
-
48
-
49
-
50
-
51
-
52
-
53
-
54
-
55
-
56
-
57
-
58
-
59
-
60
-
61
-
62
-
63
-
64
-
65
-
66
-
67
-
68
-
69
-
70
-
71
-
72
-
73
-
74
-
75
-
76
-
77
-
78
-
79
-
80
-
81
-
82
-
83
-
84
-
85
-
86
-
87
-
88
-
89
-
90
-
91
-
92
-
93
-
94
-
95
-
96
-
97
-
98
-
99
-
100
-
101
-
102
-
103
-
104
-
105
-
106
-
107
-
108
-
109
-
110
-
111
-
112
-
113
-
114
-
115
-
116
-
117
-
118
-
119
-
120
-
121
-
122
-
123
-
124
-
125
-
126
-
127
-
128
-
129
-
130
-
131
-
132
-
133
-
134
-
135
-
136
-
137
-
138
-
139
-
140
-
141
-
142
-
143
-
144
-
145
-
146
-
147
-
148
-
149
-
150
-
151
-
152
-
153
-
154
-
155
-
156
-
157
-
158
-
159
-
160
-
161
-
162
-
163
-
164
-
165
-
166
-
167
-
168
-
169
-
170
-
171
-
172
-
173
-
174
-
175
-
176
-
177
-
178
-
179
-
180
-
181
-
182
-
183
-
184
-
185
-
186
-
187
-
188
-
189
-
190
-
191
-
192
-
193
-
194
-
195
-
196
-
197
-
198
-
199
-
200
-
201
-
202
-
203
-
204
-
205
-
206
-
207
-
208
-
209
-
210
-
211
-
212
-
213
-
214
-
215
 |
 |

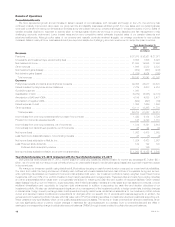
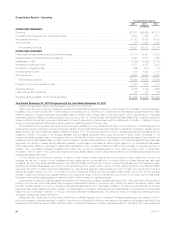
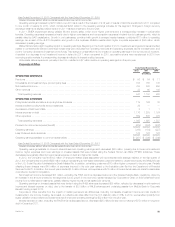
Year Ended December 31, 2012 Compared with the Year Ended December 31, 2011
Unless otherwise stated, all amounts discussed below are net of income tax.
Most of our businesses continued to experience growth in 2012, as the economy has continued to slowly improve. Our group term life and disability
businesses grew as a result of new sales, and our dental business continued to benefit from strong enrollments and renewals, as well as premiums
associated with the implementation of a new dental contract from a large customer that began in the second quarter of 2012. Although we have
discontinued selling our LTC product, we continue to collect premiums and administer the existing block of business, contributing to asset growth in the
segment. Although policy sales for both auto and homeowners decreased as compared to the prior year, the impact of an increase in the average
premium for new policies sold more than offset the decline in policy sales.
Lower severity of property & casualty catastrophe claims in the current year increased operating earnings by $31 million, mainly as a result of severe
storm activity in the second and third quarters of 2011, which were greater than the impact of severe storm activity in the fourth quarter of 2012,
primarily the result of Superstorm Sandy. While property & casualty non-catastrophe claims experience was relatively flat year over year, an increase in
severity of $24 million, was largely offset by lower claims frequency of $20 million. A decrease in claims in our dental, disability and accidental death and
dismemberment businesses resulted in a $28 million increase to operating earnings. Lower utilization in our dental business, as well as lower incidence
and approvals in our disability business drove this improvement in operating earnings. A decrease in operating earnings of $72 million resulted from less
favorable mortality experience in our life businesses, mainly due to very strong mortality experience in the prior year, which was partially offset by the
favorable net impact of reserve refinements of $30 million that occurred in both years. The mortality ratio for our life businesses has returned to a more
historically representative level of 87.9% in 2012, as adjusted for the aforementioned favorable reserve refinements, from a near record low of 86.1%in
the prior year, as adjusted for a prior year charge related to our use of the U.S. Social Security Administration’s Death Master File. In our life businesses,
the impact of the aforementioned prior year charge contributed $81 million to the increase in operating earnings. The impact of the items discussed
above related to the property & casualty business can be seen in the favorable change in the combined ratio, including catastrophes, to 96.5% in 2012
from 101.9% in the prior year, as well as the favorable change in the combined ratio, excluding catastrophes, to 88.7% in 2012 from 90.2% in the prior
year.
Current year premiums and deposits, together with growth in the securities lending program, partially offset by a reduction in allocated equity, have
resulted in an increase in our average invested assets, contributing $10 million to operating earnings. Consistent with the growth in average invested
assets from current year premiums and deposits, primarily in our LTC business, interest credited on long-duration contracts and policyholder account
balances increased by $15 million. Current year results include a $50 million impairment charge on an intangible asset, related to a previously acquired
dental business, as well as increased expenses associated with the implementation of the new dental contract in the second quarter of 2012, partially
offset by lower marketing and sales-related expenses in our LTC business. An increase in the average premium per policy in both our auto and
homeowners businesses, as well as an increase in exposures, improved operating earnings by $34 million.
The impact of the low interest rate environment combined with lower returns in the real estate and alternative investment markets resulted in a
decline in investment yields on our fixed maturity securities, securities lending program, real estate joint ventures and alternative investments. Unlike in
the Retail and Corporate Benefit Funding segments, a change in investment yield does not necessarily drive a corresponding change in the rates
credited on certain insurance liabilities. The reduction in investment yield was partially offset by marginally lower crediting rates in the current year, and
resulted in a $3 million decrease in operating earnings.
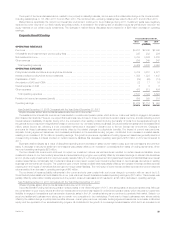
Year Ended December 31, 2011 Compared with the Year Ended December 31, 2010
Unless otherwise stated, all amounts discussed below are net of income tax.
In 2011, strong mortality and morbidity results coupled with the net impact of asset growth in our life and health businesses, as well as additional
favorable development of prior year losses in our property & casualty business contributed to the increase in operating earnings. These positive results
were significantly offset by the negative impact of severe weather in our property & casualty business, including a record number of tornadoes in the
second quarter and Hurricane Irene in the third quarter. In addition, 2011 results for our life business include a charge taken in the third quarter related to
the use of the U.S. Social Security Administration’s Death Master File. The impacts of the sustained low interest rate environment also depressed
operating earnings.
Policy sales in our property & casualty business decreased as the housing and new automobile sales markets remained sluggish. However, average
premium per policy increased for both our homeowners and auto policies and we benefited from additional growth in exposures over the prior period.
For our life and health businesses, sustained high levels of unemployment and a challenging pricing environment continued to depress growth. Our
dental business benefited from higher enrollment and certain pricing actions, but this was more than offset by a decline in revenues from our disability
business. This reduction was mainly due to net customer cancellations and lower covered lives. Our LTC revenues were flat period over period,
consistent with the discontinuance of the sale of this coverage at the end of 2010.
Although revenues have declined from the prior year, current year premiums and deposits resulted in an increase in our average invested assets,
which contributed $74 million to operating earnings. Mirroring the net growth in average invested assets, primarily in our LTC business, interest credited
on long-duration contracts and on our PABs increased by $16 million. The increase in average premium per policy in both our homeowners and auto
businesses improved operating earnings by $21 million and the net increase in exposures resulted in a $10 million increase in operating earnings as the
positive impact from higher premiums exceeded the negative impact from higher claims. Higher commissions, resulting from the aforementioned
increase in average premium per policy, coupled with an increase in other volume-related expenses, contributed to a $9 million increase in other
expenses, including the net change in DAC. In our dental business, expenses related to the implementation of a large contract decreased operating
earnings by $14 million.
Lower claims incidence resulted in very strong life mortality experience, and contributed $71 million to operating earnings. Pricing actions and
improved claims experience, mainly the result of stabilizing benefits utilization, drove a $57 million increase in our dental results. Higher closures and
lower incidence in 2011 contributed to the $43 million increase in our disability results. In our property & casualty business, additional favorable
development of prior year losses contributed $14 million to operating earnings. Partially offsetting these increases to operating earnings, catastrophe-
related losses increased $70 million compared to 2010, mainly due to severe storm activity in the U.S. during the second and third quarters of 2011. In
addition, current year non-catastrophe claim costs increased $34 million as a result of higher claim frequencies in both our auto and homeowners
businesses, due primarily to more severe winter weather in the first quarter of 2011 and to non-catastrophe wind and hail through the remainder of the
year. In our life business, an $81 million charge related to our use of the U.S. Social Security Administration’s Death Master File, contributed to the
decrease in operating earnings during the third quarter of the current year. Lastly, LTC results decreased $10 million resulting from less favorable claims
experience in the current period.
28 MetLife, Inc.