Duke Energy 2012 Annual Report Download - page 85
Download and view the complete annual report
Please find page 85 of the 2012 Duke Energy annual report below. You can navigate through the pages in the report by either clicking on the pages listed below, or by using the keyword search tool below to find specific information within the annual report.-
 1
1 -
2
-
3
-
4
-
5
-
6
-
7
-
8
-
9
-
10
-
11
-
12
-
13
-
14
-
15
-
16
-
17
-
18
-
19
-
20
-
21
-
22
-
23
-
24
-
25
-
26
-
27
-
28
-
29
-
30
-
31
-
32
-
33
-
34
-
35
-
36
-
37
-
38
-
39
-
40
-
41
-
42
-
43
-
44
-
45
-
46
-
47
-
48
-
49
-
50
-
51
-
52
-
53
-
54
-
55
-
56
-
57
-
58
-
59
-
60
-
61
-
62
-
63
-
64
-
65
-
66
-
67
-
68
-
69
-
70
-
71
-
72
-
73
-
74
-
 75
75 -
 76
76 -
 77
77 -
 78
78 -
 79
79 -
 80
80 -
 81
81 -
 82
82 -
 83
83 -
 84
84 -
 85
85 -
 86
86 -
 87
87 -
 88
88 -
 89
89 -
 90
90 -
 91
91 -
 92
92 -
 93
93 -
 94
94 -
 95
95 -
96
-
97
-
98
-
99
-
100
-
101
-
102
-
103
-
104
-
105
-
106
-
107
-
108
-
109
-
110
-
111
-
112
-
113
-
114
-
115
-
116
-
117
-
118
-
119
-
120
-
121
-
122
-
123
-
124
-
125
-
126
-
127
-
128
-
129
-
130
-
131
-
132
-
133
-
134
-
135
-
136
-
137
-
138
-
139
-
140
-
141
-
142
-
143
-
144
-
145
-
146
-
147
-
148
-
149
-
150
-
151
-
152
-
153
-
154
-
155
-
156
-
157
-
158
-
159
-
160
-
161
-
162
-
163
-
164
-
165
-
166
-
167
-
168
-
169
-
170
-
171
-
172
-
173
-
174
-
175
-
176
-
177
-
178
-
179
-
180
-
181
-
182
-
183
-
184
-
185
-
186
-
187
-
188
-
189
-
190
-
191
-
192
-
193
-
194
-
195
-
196
-
197
-
198
-
199
-
200
-
201
-
202
-
203
-
204
-
205
-
206
-
207
-
208
-
209
-
210
-
211
-
212
-
213
-
214
-
215
-
216
-
217
-
218
-
219
-
220
-
221
-
222
-
223
-
224
-
225
-
226
-
227
-
228
-
229
-
230
-
231
-
232
-
233
-
234
-
235
-
236
-
237
-
238
-
239
-
240
-
241
-
242
-
243
-
244
-
245
-
246
-
247
-
248
-
249
-
250
-
251
-
252
-
253
-
254
-
255
-
256
-
257
-
258
-
259
-
260
-
261
-
262
-
263
-
264
-
265
-
266
-
267
-
268
-
269
-
270
-
271
-
272
-
273
-
274
-
275
-
276
-
277
-
278
-
279
-
280
-
281
-
282
-
283
-
284
-
285
-
286
-
287
-
288
-
289
-
290
-
291
-
292
-
293
-
294
-
295
-
296
-
297
-
298
-
299
-
300
-
301
-
302
-
303
-
304
-
305
-
306
-
307
-
308
 |
 |

65
PART II
Ohio, Duke Energy Kentucky and Duke Energy Indiana. See Note 18 to the
Consolidated Financial Statements, “Variable Interest Entities.”
Based on the Duke Energy Registrants’ policies for managing credit risk,
their exposures and their credit and other reserves, the Duke Energy Registrants
do not currently anticipate a materially adverse effect on their consolidated
fi nancial position or results of operations as a result of non-performance by any
counterparty.
European Exposures.
At December 31, 2012, Duke Energy held $62 million of money market
funds and short term investments in investment-grade debt securities issued
by fi nancial and nonfi nancial institutions that are domiciled in Europe or have
exposures to European sovereign debt. This amount is recorded at fair value
and included in Cash and cash equivalents and Short-term investment in the
Consolidated Balance Sheets. A disorderly default by or withdrawal of a member
nation from the euro zone and fi nancial stress in other European countries could
require Duke Energy to recognize an impairment of some or all of these securities.
Interest Rate Risk
The Duke Energy Registrants are exposed to risk resulting from changes
in interest rates as a result of their issuance of variable and fi xed rate debt and
commercial paper. The Duke Energy Registrants manage interest rate exposure
by limiting variable-rate exposures to a percentage of total capitalization and
by monitoring the effects of market changes in interest rates. The Duke Energy
Registrants also enter into fi nancial derivative instruments, which may include
instruments such as, but not limited to, interest rate swaps, swaptions and U.S.
Treasury lock agreements to manage and mitigate interest rate risk exposure.
See Notes 1, 6, 15, and 16 to the Consolidated Financial Statements, “Summary
of Signifi cant Accounting Policies,” “Debt and Credit Facilities,” “Risk
Management, Derivative Instruments and Hedging Activities,” and “Fair Value of
Financial Assets and Liabilities.”
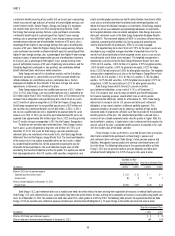
The table below summarizes the potential effect of interest rate changes
on the Duke Energy Registrants’ pre-tax net income, based on a sensitivity
analysis performed as of December 31, 2012 and December 31, 2011.
Summary of Sensitivity Analysis for Interest Rate Risks
(in millions)
Potential increase (+) or
decrease (-) in interest
expense:(a)
Assuming Market
Interest Rates Average 1%
Higher (+) or Lower (-)
in 2013 than 2012. As of
December 31, 2012
Assuming Market
Interest Rates Average 1%
Higher (+) or Lower (-)
in 2012 than 2011. As of
December 31, 2011
Duke Energy +/- $32 +/- $ 7
Duke Energy Carolinas +/- $ 3 +/- $ 5
Progress Energy +/- $19 +/- $20
Progress Energy Carolinas +/- $15 +/- $13
Progress Energy Florida +/- $ 2 +/- $ 7
Duke Energy Ohio +/- $13 +/- $ 8
Duke Energy Indiana +/- $ 7 +/- $ 8
(a) Amounts presented net of offsetting impacts in interest income.
These amounts were estimated by considering the impact of the
hypothetical interest rates on variable-rate securities outstanding, adjusted
for interest rate hedges, short-term and long-term investments, cash and
cash equivalents outstanding as of December 31, 2012 and 2011. The change
in interest rate sensitivity for the Duke Energy Registrants’ is primarily due
to changes in short-term debt balances and cash balances. If interest rates
changed signifi cantly, management would likely take actions to manage its
exposure to the change. However, due to the uncertainty of the specifi c actions
that would be taken and their possible effects, the sensitivity analysis assumes
no changes in the Duke Energy Registrants’ fi nancial structure.
Marketable Securities Price Risk
As described further in Note 17 to the Consolidated Financial Statements,
“Investments in Debt and Equity Securities,” Duke Energy invests in debt
and equity securities as part of various investment portfolios to fund certain
obligations of the business. The vast majority of the investments in equity
securities are within the NDTF and assets of the various pension and other
post-retirement benefi t plans.
Pension Plan Assets.
Duke Energy and Progress Energy maintain investments to help fund the
costs of providing non-contributory defi ned benefi t retirement and other post-
retirement benefi t plans. These investments are exposed to price fl uctuations in
equity markets and changes in interest rates. The equity securities held in these
pension plans are diversifi ed to achieve broad market participation and reduce
the impact of any single investment, sector or geographic region. Duke Energy
and Progress Energy have established asset allocation targets for their pension
plan holdings, which take into consideration the investment objectives and the
risk profi le with respect to the trust in which the assets are held. These target
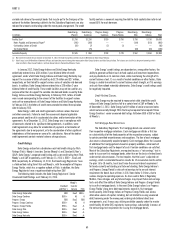
allocations are presented in the table below.
Asset Target Allocation %
Equity securities 56 %
Debt securities 32 %
Other 12 %
A signifi cant decline in the value of plan asset holdings could require
Duke Energy to increase funding of its pension plans in future periods, which
could adversely affect cash fl ows of the Duke Energy Registrants in those
periods. Additionally, a decline in the fair value of plan assets, absent additional
cash contributions to the plan, could increase the amount of pension cost
required to be recorded in future periods, which could adversely affect the Duke
Energy Registrants’ results of operations in those periods. Contributions to
qualifi ed pension plans during 2012 are presented in the table below.
Schedule of Qualifi ed Pension Plan Contributions
Year Ended
December 31, 2012
Duke Energy $ 304
Progress Energy $ 346
Progress Energy Carolinas $ 141
Progress Energy Florida $ 128
Duke Energy intends to contribute $350 million to its qualifi ed pension
plan in 2013. See Note 23 to the Consolidated Financial Statements, “Employee
Benefi t Plans,” for additional information on pension plan assets.
NDTF.
As required by the NRC, NCUC, PSCSC and the FPSC, Duke Energy
Carolinas, Progress Energy Carolinas and Progress Energy Florida maintain
trust funds to fund the costs of nuclear decommissioning. As of December 31,
2012, these funds were invested primarily in domestic and international
equity securities, debt securities, fi xed-income securities, cash and cash
equivalents and short-term investments. Per the NRC, NCUC, PSCSC and FPSC
requirements, these funds may be used only for activities related to nuclear
decommissioning. The investments in equity securities are exposed to price
fl uctuations in equity markets. The Duke Energy Registrants actively monitor
their portfolios by benchmarking the performance of their investments against
certain indices and by maintaining, and periodically reviewing, target allocation
percentages for various asset classes. Accounting for nuclear decommissioning
recognizes that costs are recovered through Duke Energy Carolinas’, Progress