Duke Energy 2012 Annual Report Download - page 225
Download and view the complete annual report
Please find page 225 of the 2012 Duke Energy annual report below. You can navigate through the pages in the report by either clicking on the pages listed below, or by using the keyword search tool below to find specific information within the annual report.-
 1
1 -
2
-
3
-
4
-
5
-
6
-
7
-
8
-
9
-
10
-
11
-
12
-
13
-
14
-
15
-
16
-
17
-
18
-
19
-
20
-
21
-
22
-
23
-
24
-
25
-
26
-
27
-
28
-
29
-
30
-
31
-
32
-
33
-
34
-
35
-
36
-
37
-
38
-
39
-
40
-
41
-
42
-
43
-
44
-
45
-
46
-
47
-
48
-
49
-
50
-
51
-
52
-
53
-
54
-
55
-
56
-
57
-
58
-
59
-
60
-
61
-
62
-
63
-
64
-
65
-
66
-
67
-
68
-
69
-
70
-
71
-
72
-
73
-
74
-
75
-
76
-
77
-
78
-
79
-
80
-
81
-
82
-
83
-
84
-
85
-
86
-
87
-
88
-
89
-
90
-
91
-
92
-
93
-
94
-
95
-
96
-
97
-
98
-
99
-
100
-
101
-
102
-
103
-
104
-
105
-
106
-
107
-
108
-
109
-
110
-
111
-
112
-
113
-
114
-
115
-
116
-
117
-
118
-
119
-
120
-
121
-
122
-
123
-
124
-
125
-
126
-
127
-
128
-
129
-
130
-
131
-
132
-
133
-
134
-
135
-
136
-
137
-
138
-
139
-
140
-
141
-
142
-
143
-
144
-
145
-
146
-
147
-
148
-
149
-
150
-
151
-
152
-
153
-
154
-
155
-
156
-
157
-
158
-
159
-
160
-
161
-
162
-
163
-
164
-
165
-
166
-
167
-
168
-
169
-
170
-
171
-
172
-
173
-
174
-
175
-
176
-
177
-
178
-
179
-
180
-
181
-
182
-
183
-
184
-
185
-
186
-
187
-
188
-
189
-
190
-
191
-
192
-
193
-
194
-
195
-
196
-
197
-
198
-
199
-
200
-
201
-
202
-
203
-
204
-
205
-
206
-
207
-
208
-
209
-
210
-
211
-
212
-
213
-
214
-
 215
215 -
 216
216 -
 217
217 -
 218
218 -
 219
219 -
 220
220 -
 221
221 -
 222
222 -
 223
223 -
 224
224 -
 225
225 -
 226
226 -
 227
227 -
 228
228 -
 229
229 -
 230
230 -
 231
231 -
 232
232 -
 233
233 -
 234
234 -
 235
235 -
236
-
237
-
238
-
239
-
240
-
241
-
242
-
243
-
244
-
245
-
246
-
247
-
248
-
249
-
250
-
251
-
252
-
253
-
254
-
255
-
256
-
257
-
258
-
259
-
260
-
261
-
262
-
263
-
264
-
265
-
266
-
267
-
268
-
269
-
270
-
271
-
272
-
273
-
274
-
275
-
276
-
277
-
278
-
279
-
280
-
281
-
282
-
283
-
284
-
285
-
286
-
287
-
288
-
289
-
290
-
291
-
292
-
293
-
294
-
295
-
296
-
297
-
298
-
299
-
300
-
301
-
302
-
303
-
304
-
305
-
306
-
307
-
308
 |
 |

205
PART II
DUKE ENERGY CORPORATION • DUKE ENERGY CAROLINAS, LLC • PROGRESS ENERGY, INC. • CAROLINA POWER & LIGHT COMPANY d/b/a PROGRESS
ENERGY CAROLINAS, INC. • FLORIDA POWER CORPORATION d/b/a PROGRESS ENERY FLORIDA, INC. • DUKE ENERGY OHIO, INC. • DUKE ENERGY INDIANA, INC.
Combined Notes to Consolidated Financial Statements – (Continued)
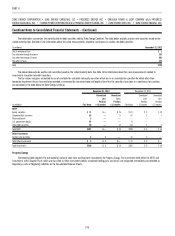
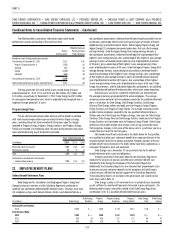
The following table shows the gross and net receivables sold:
Duke Energy Ohio Duke Energy Indiana
(percentages) 2012 2011 2012 2011
Anticipated credit loss ratio 0.7 0.8 0.3 0.4
Discount rate 1.2 2.6 1.2 2.6
Receivable turnover rate 12.7 12.7 10.2 10.2
Duke Energy Ohio Duke Energy Indiana
December 31, December 31,
(in millions) 2012 2011 2012 2011
Receivables sold $282 $302 $ 289 $279
Less: Retained interests 97 129 116 139
Net receivables sold $185 $173 $ 173 $140
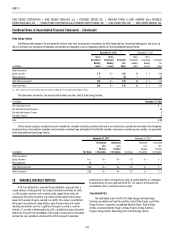
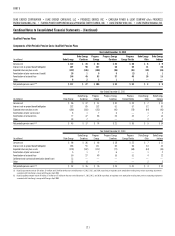
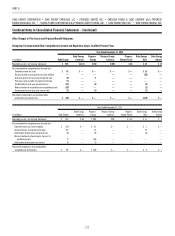
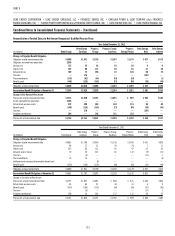
The following tables show the retained interests, sales, and cash fl ows
related to receivables sold:
(in millions) Duke Energy Ohio Duke Energy Indiana
Years Ended December 31, 2012
Sales
Receivables sold $2,154 $2,773
Loss recognized on sale 13 12
Cash Flows
Cash proceeds from receivables sold 2,172 2,784
Collection fees received 1 1
Return received on retained interests 5 7
(in millions) Duke Energy Ohio Duke Energy Indiana
Years Ended December 31, 2011
Sales
Receivables sold $ 2,390 $2,658
Loss recognized on sale 21 16
Cash Flows
Cash proceeds from receivables sold 2,474 2,674
Collection fees received 1 1
Return received on retained interests 12 13
(in millions) Duke Energy Ohio Duke Energy Indiana
Years Ended December 31, 2010
Sales
Receivables sold $ 2,858 $2,537
Loss recognized on sale 26 17
Cash Flows
Cash proceeds from receivables sold 2,809 2,474
Collection fees received 1 1
Return received on retained interests 15 13
Cash fl ows from the sale of receivables are refl ected within Operating
Activities on Duke Energy Ohio’s and Duke Energy Indiana’s Consolidated
Statements of Cash Flows.
Collection fees received in connection with the servicing of transferred
accounts receivable are included in Operation, Maintenance and Other on
Duke Energy Ohio’s and Duke Energy Indiana’s Consolidated Statements of
Operations. The loss recognized on the sale of receivables is calculated monthly
by multiplying the receivables sold during the month by the required discount
which is derived monthly utilizing a three year weighted average formula that
considers charge-off history, late charge history, and turnover history on the
sold receivables, as well as a component for the time value of money. The
discount rate, or component for the time value of money, is calculated monthly
by summing the prior month-end LIBOR plus a fi xed rate of 1.00 percent as of
December 31, 2012, as compared to prior month-end LIBOR plus 2.39 percent
as of December 31, 2011.
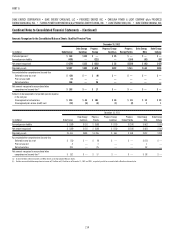
19. EARNINGS PER COMMON SHARE (EPS)
Basic Earnings Per Share (EPS) is computed by dividing net income
attributable to Duke Energy common shareholders, adjusted for distributed and
undistributed earnings allocated to participating securities, by the weighted-
average number of common shares outstanding during the period. Diluted
EPS is computed by dividing net income attributable to Duke Energy common
shareholders, as adjusted for distributed and undistributed earnings allocated
to participating securities, by the diluted weighted-average number of common
shares outstanding during the period. Diluted EPS refl ects the potential dilution
that could occur if securities or other agreements to issue common stock,
such as stock options, phantom shares and stock-based performance unit
awards were exercised or settled.
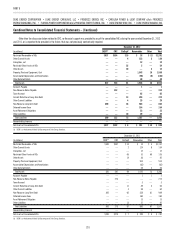
Duke Energy
On July 2, 2012, just prior to the close of the merger with Progress Energy,
Duke Energy executed a one-for-three reverse stock split. All earnings per share
amounts included in this 10-K are presented as if the one-for-three reverse
stock split had been effective January 1, 2010. The following table presents
Duke Energy’s basic and diluted EPS calculations and reconciles the weighted-
average number of common shares outstanding to the diluted weighted-average
number of common shares outstanding.