Duke Energy 2012 Annual Report Download - page 64
Download and view the complete annual report
Please find page 64 of the 2012 Duke Energy annual report below. You can navigate through the pages in the report by either clicking on the pages listed below, or by using the keyword search tool below to find specific information within the annual report.-
 1
1 -
2
-
3
-
4
-
5
-
6
-
7
-
8
-
9
-
10
-
11
-
12
-
13
-
14
-
15
-
16
-
17
-
18
-
19
-
20
-
21
-
22
-
23
-
24
-
25
-
26
-
27
-
28
-
29
-
30
-
31
-
32
-
33
-
34
-
35
-
36
-
37
-
38
-
39
-
40
-
41
-
42
-
43
-
44
-
45
-
46
-
47
-
48
-
49
-
50
-
51
-
52
-
53
-
 54
54 -
 55
55 -
 56
56 -
 57
57 -
 58
58 -
 59
59 -
 60
60 -
 61
61 -
 62
62 -
 63
63 -
 64
64 -
 65
65 -
 66
66 -
 67
67 -
 68
68 -
 69
69 -
 70
70 -
 71
71 -
 72
72 -
 73
73 -
 74
74 -
75
-
76
-
77
-
78
-
79
-
80
-
81
-
82
-
83
-
84
-
85
-
86
-
87
-
88
-
89
-
90
-
91
-
92
-
93
-
94
-
95
-
96
-
97
-
98
-
99
-
100
-
101
-
102
-
103
-
104
-
105
-
106
-
107
-
108
-
109
-
110
-
111
-
112
-
113
-
114
-
115
-
116
-
117
-
118
-
119
-
120
-
121
-
122
-
123
-
124
-
125
-
126
-
127
-
128
-
129
-
130
-
131
-
132
-
133
-
134
-
135
-
136
-
137
-
138
-
139
-
140
-
141
-
142
-
143
-
144
-
145
-
146
-
147
-
148
-
149
-
150
-
151
-
152
-
153
-
154
-
155
-
156
-
157
-
158
-
159
-
160
-
161
-
162
-
163
-
164
-
165
-
166
-
167
-
168
-
169
-
170
-
171
-
172
-
173
-
174
-
175
-
176
-
177
-
178
-
179
-
180
-
181
-
182
-
183
-
184
-
185
-
186
-
187
-
188
-
189
-
190
-
191
-
192
-
193
-
194
-
195
-
196
-
197
-
198
-
199
-
200
-
201
-
202
-
203
-
204
-
205
-
206
-
207
-
208
-
209
-
210
-
211
-
212
-
213
-
214
-
215
-
216
-
217
-
218
-
219
-
220
-
221
-
222
-
223
-
224
-
225
-
226
-
227
-
228
-
229
-
230
-
231
-
232
-
233
-
234
-
235
-
236
-
237
-
238
-
239
-
240
-
241
-
242
-
243
-
244
-
245
-
246
-
247
-
248
-
249
-
250
-
251
-
252
-
253
-
254
-
255
-
256
-
257
-
258
-
259
-
260
-
261
-
262
-
263
-
264
-
265
-
266
-
267
-
268
-
269
-
270
-
271
-
272
-
273
-
274
-
275
-
276
-
277
-
278
-
279
-
280
-
281
-
282
-
283
-
284
-
285
-
286
-
287
-
288
-
289
-
290
-
291
-
292
-
293
-
294
-
295
-
296
-
297
-
298
-
299
-
300
-
301
-
302
-
303
-
304
-
305
-
306
-
307
-
308
 |
 |

44
PART II
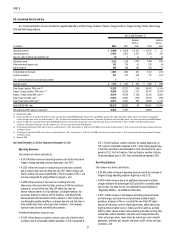
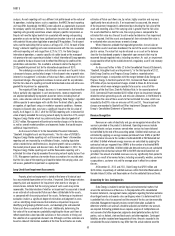
The following table shows the percent changes in GWh sales and average number of customers for Duke Energy Carolinas. Except as otherwise noted, the below
percentages represent billed sales only for the periods presented and are not weather normalized.
Increase (decrease) over prior year 2012 2011
Residential sales(a) (7.2)% (5.7)%
General service sales(a) (0.4)% (1.3)%
Industrial sales(a) 0.9% 0.8%
Wholesale power sales 4.0% 1.2%
Total sales(b) (0.9)% (3.9)%
Average number of customers 0.6% 0.3%
(a) Major components of retail sales.
(b) Consists of all components of sales, including all billed and unbilled retail sales, and wholesale sales to incorporated municipalities and to public and private utilities and power marketers.
The increase in Duke Energy Carolinas’ net income for the year ended
December 31, 2012, compared to December 31, 2011, was primarily due to the
following factors:
Operating Revenues.
The variance was primarily due to:
• A $323 million increase in net retail pricing and rate riders primarily
due to revised retail base rates implemented in North Carolina and
South Carolina in the fi rst quarter of 2012, and revenues recognized for
the energy effi ciency programs, and
• A $40 million increase in weather adjusted sales volumes to customers
primarily due to higher weather-normal sales to retail customers and an
extra day of revenues due to 2012 being a leap year.
Partially offsetting these increases were:
• A $141 million (net of fuel) decrease in GWh sales to retail customers
due to overall unfavorable weather conditions. The weather statistics
for heating degree days in 2012 were unfavorable compared to the
same period in 2011, while weather statistics for cooling degree days
were less favorable in 2012 compared to the same period in 2011, and
• An $88 million decrease in fuel revenues driven primarily by decreased
demand from retail customers mainly due to overall unfavorable
weather conditions, partially offset by higher fuel rates in both North
Carolina and South Carolina. Fuel revenues represent sales to retail and
wholesale customers.
Operating Expenses.
The variance was primarily due to:
• A $107 million increase in depreciation and amortization primarily due
to increases in depreciation as a result of additional plant in service
and amortization of certain regulatory assets,
• A $75 million increase in operating and maintenance expenses primarily
due to Duke Energy Carolinas’ portion of the costs associated with the
Progress Energy merger including donations, severance, and certain other
costs, higher non-outage and outage costs at generation plants, increased
corporate costs, and required donations resulting from the most recent
North Carolina and South Carolina rate cases, partially offset by the
establishment of regulatory assets in the fi rst quarter of 2012, pursuant
to regulatory orders for future recovery of certain employee severance
costs related to the 2010 voluntary severance plan and other costs,
decreased storm costs, and lower governance costs, and
• A $25 million increase in general taxes primarily due to higher revenue
related taxes in 2012, higher North Carolina property tax expense,
capitalization of North Carolina property taxes in the prior year related
to future generation plants, a favorable prior year resolution of a
property tax issue related to pollution control equipment exemptions
and a sales and use tax refund in 2011 with no comparable refund in
2012, and
• A $19 million increase in impairment charges primarily related to
the merger with Progress Energy. These charges relate to planned
transmission project costs for which no recovery is expected, and
certain costs associated with mitigation sales pursuant to merger
settlement agreements with the Federal Energy Regulatory Commission
(FERC).
Partially offsetting these increases was:
• An $80 million decrease in fuel expense (including purchased power)
primarily related to lower volume of coal used in electric generation due
to lower demand from retail customers based on overall unfavorable
weather conditions and lower coal-fi red generation due to low natural
gas prices.
Interest Expense.
The variance is primarily due to lower debt return on deferred projects
and a lower debt component of allowance for funds used during construction
(AFUDC).
Income Tax Expense.
The variance in income tax expense is primarily due to prior year state
audit settlements. The effective tax rate for the years ended December 31, 2012
and 2011 was 34.3% and 36.1%, respectively.
Matters Impacting Future Duke Energy Carolinas Results
Duke Energy Carolinas fi led a rate case on February 4, 2013 in North
Carolina and plans to fi le a rate case in South Carolina in early 2013. These
planned rates cases are needed to recover investments in Duke Energy
Carolinas’ ongoing infrastructure modernization projects and operating costs.
Duke Energy Carolinas’ earnings could be adversely impacted if these rate cases
are denied or delayed by either of the state regulatory commissions.
The ability to integrate Progress Energy businesses and realize cost
savings and any other synergies expected from the merger with Progress Energy
could be different from what Duke Energy Carolinas expects and may have a
signifi cant impact on Duke Energy Carolinas’ results of operations.