Duke Energy 2012 Annual Report Download - page 70
Download and view the complete annual report
Please find page 70 of the 2012 Duke Energy annual report below. You can navigate through the pages in the report by either clicking on the pages listed below, or by using the keyword search tool below to find specific information within the annual report.-
 1
1 -
2
-
3
-
4
-
5
-
6
-
7
-
8
-
9
-
10
-
11
-
12
-
13
-
14
-
15
-
16
-
17
-
18
-
19
-
20
-
21
-
22
-
23
-
24
-
25
-
26
-
27
-
28
-
29
-
30
-
31
-
32
-
33
-
34
-
35
-
36
-
37
-
38
-
39
-
40
-
41
-
42
-
43
-
44
-
45
-
46
-
47
-
48
-
49
-
50
-
51
-
52
-
53
-
54
-
55
-
56
-
57
-
58
-
59
-
 60
60 -
 61
61 -
 62
62 -
 63
63 -
 64
64 -
 65
65 -
 66
66 -
 67
67 -
 68
68 -
 69
69 -
 70
70 -
 71
71 -
 72
72 -
 73
73 -
 74
74 -
 75
75 -
 76
76 -
 77
77 -
 78
78 -
 79
79 -
 80
80 -
81
-
82
-
83
-
84
-
85
-
86
-
87
-
88
-
89
-
90
-
91
-
92
-
93
-
94
-
95
-
96
-
97
-
98
-
99
-
100
-
101
-
102
-
103
-
104
-
105
-
106
-
107
-
108
-
109
-
110
-
111
-
112
-
113
-
114
-
115
-
116
-
117
-
118
-
119
-
120
-
121
-
122
-
123
-
124
-
125
-
126
-
127
-
128
-
129
-
130
-
131
-
132
-
133
-
134
-
135
-
136
-
137
-
138
-
139
-
140
-
141
-
142
-
143
-
144
-
145
-
146
-
147
-
148
-
149
-
150
-
151
-
152
-
153
-
154
-
155
-
156
-
157
-
158
-
159
-
160
-
161
-
162
-
163
-
164
-
165
-
166
-
167
-
168
-
169
-
170
-
171
-
172
-
173
-
174
-
175
-
176
-
177
-
178
-
179
-
180
-
181
-
182
-
183
-
184
-
185
-
186
-
187
-
188
-
189
-
190
-
191
-
192
-
193
-
194
-
195
-
196
-
197
-
198
-
199
-
200
-
201
-
202
-
203
-
204
-
205
-
206
-
207
-
208
-
209
-
210
-
211
-
212
-
213
-
214
-
215
-
216
-
217
-
218
-
219
-
220
-
221
-
222
-
223
-
224
-
225
-
226
-
227
-
228
-
229
-
230
-
231
-
232
-
233
-
234
-
235
-
236
-
237
-
238
-
239
-
240
-
241
-
242
-
243
-
244
-
245
-
246
-
247
-
248
-
249
-
250
-
251
-
252
-
253
-
254
-
255
-
256
-
257
-
258
-
259
-
260
-
261
-
262
-
263
-
264
-
265
-
266
-
267
-
268
-
269
-
270
-
271
-
272
-
273
-
274
-
275
-
276
-
277
-
278
-
279
-
280
-
281
-
282
-
283
-
284
-
285
-
286
-
287
-
288
-
289
-
290
-
291
-
292
-
293
-
294
-
295
-
296
-
297
-
298
-
299
-
300
-
301
-
302
-
303
-
304
-
305
-
306
-
307
-
308
 |
 |

50
PART II
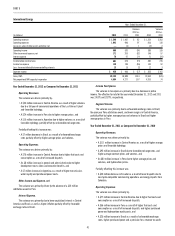
Income Tax Expense.
The variance in tax expense is primarily due to an increase in the effective
tax rate. The effective tax rate for the years ended December 31, 2012 and
2011 was 36.0% and 33.1%, respectively. The increase in the effective tax
rate is primarily due to a $10 million reduction of deferred tax liabilities as a
result of an election related to the transfer of certain gas-fi red generation assets
to its wholly owned subsidiary Duke Energy Commercial Asset Management,
LLC (DECAM) in the second quarter of 2011.
Matters Impacting Future Duke Energy Ohio Results
Duke Energy Ohio fi led electric and gas distribution rate cases in July
2012. These planned rate cases are needed to recover capital investments,
costs associated with MGP sites and operating costs. Duke Energy Ohio’s
earnings could be adversely impacted if these rate cases are denied or delayed
by the state regulatory commission.
The current low energy price projections, as well as recently issued and
proposed environmental regulations pertaining to coal and coal-fi red generating
facilities, could impact future cash fl ows and market valuations of Duke Energy
Ohio’s coal-fi red generation assets which could lead to impairment charges.
DUKE ENERGY INDIANA
INTRODUCTION
Management’s Discussion and Analysis should be read in conjunction
with the accompanying Consolidated Financial Statements and Notes for the
years ended December 31, 2012, 2011, and 2010.
BASIS OF PRESENTATION
The results of operations and variance discussion for Duke Energy
Indiana is presented in a reduced disclosure format in accordance with General
Instruction (I)(2)(a) of Form 10-K.
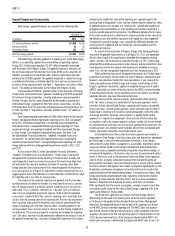
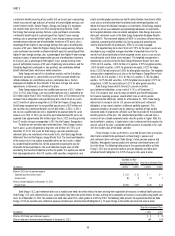
RESULTS OF OPERATIONS
Years Ended December 31,
(in millions) 2012 2011 Variance
Operating revenues $2,717 $ 2,622 $ 95
Operating expenses 2,792 2,340 452
Operating (loss) income (75) 282 (357)
Other income and expense, net 90 97 (7)
Interest expense 138 137 1
(Loss) Income before income taxes (123) 242 (365)
Income tax (benefi t) expense (73) 74 (147)
Net (loss) income $ (50) $ 168 $(218)
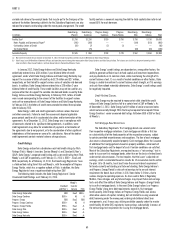
The following table shows the percent changes in GWh sales and average number of customers for Duke Energy Indiana. Except as otherwise noted, the below
percentages represent billed sales only for the periods presented and are not weather normalized.
Increase (decrease) over prior year 2012 2011
Residential sales(a) (4.8)% (3.0)%
General service sales(a) (0.5)% (1.5)%
Industrial sales(a) 1.7 % 1.5 %
Wholesale power sales 7.9 % (19.1)%
Total sales(b) 1.2 % (4.9)%
Average number of customers 0.6 % 0.1 %
(a) Major components of retail sales.
(b) Consists of all components of sales, including all billed and unbilled retail sales, and wholesale sales to incorporated municipalities and to public and private utilities and power marketers.
Duke Energy Indiana’s net loss for the year ended December 31, 2012
compared to net income for the year ended December 31, 2011 was primarily
due to the following factors:
Operating Revenues.
The variance was primarily due to:
• A $102 million net increase in fuel revenues (including emission
allowances) primarily due to an increase in fuel rates as a result of
higher fuel and purchased power costs,
• A $17 million net increase in rate riders primarily related to higher recoveries
under the clean coal technology and energy effi ciency riders, and
• A $12 million increase in rate pricing due to the positive impact on
overall average prices of lower sales volumes.
Partially offsetting these increases were:
• A $31 million decrease in retail revenue due to a regulatory order to
refund revenues to customers related to the Edwardsport IGCC plant that
is currently under construction. See Note 4 to the Consolidated Financial
Statements “Regulatory Matters,” for additional information, and
• A $7 million decrease in retail revenues related to less favorable
weather conditions and weather-normal sales volumes in 2012
compared to 2011.