Duke Energy 2012 Annual Report Download - page 262
Download and view the complete annual report
Please find page 262 of the 2012 Duke Energy annual report below. You can navigate through the pages in the report by either clicking on the pages listed below, or by using the keyword search tool below to find specific information within the annual report.-
 1
1 -
2
-
3
-
4
-
5
-
6
-
7
-
8
-
9
-
10
-
11
-
12
-
13
-
14
-
15
-
16
-
17
-
18
-
19
-
20
-
21
-
22
-
23
-
24
-
25
-
26
-
27
-
28
-
29
-
30
-
31
-
32
-
33
-
34
-
35
-
36
-
37
-
38
-
39
-
40
-
41
-
42
-
43
-
44
-
45
-
46
-
47
-
48
-
49
-
50
-
51
-
52
-
53
-
54
-
55
-
56
-
57
-
58
-
59
-
60
-
61
-
62
-
63
-
64
-
65
-
66
-
67
-
68
-
69
-
70
-
71
-
72
-
73
-
74
-
75
-
76
-
77
-
78
-
79
-
80
-
81
-
82
-
83
-
84
-
85
-
86
-
87
-
88
-
89
-
90
-
91
-
92
-
93
-
94
-
95
-
96
-
97
-
98
-
99
-
100
-
101
-
102
-
103
-
104
-
105
-
106
-
107
-
108
-
109
-
110
-
111
-
112
-
113
-
114
-
115
-
116
-
117
-
118
-
119
-
120
-
121
-
122
-
123
-
124
-
125
-
126
-
127
-
128
-
129
-
130
-
131
-
132
-
133
-
134
-
135
-
136
-
137
-
138
-
139
-
140
-
141
-
142
-
143
-
144
-
145
-
146
-
147
-
148
-
149
-
150
-
151
-
152
-
153
-
154
-
155
-
156
-
157
-
158
-
159
-
160
-
161
-
162
-
163
-
164
-
165
-
166
-
167
-
168
-
169
-
170
-
171
-
172
-
173
-
174
-
175
-
176
-
177
-
178
-
179
-
180
-
181
-
182
-
183
-
184
-
185
-
186
-
187
-
188
-
189
-
190
-
191
-
192
-
193
-
194
-
195
-
196
-
197
-
198
-
199
-
200
-
201
-
202
-
203
-
204
-
205
-
206
-
207
-
208
-
209
-
210
-
211
-
212
-
213
-
214
-
215
-
216
-
217
-
218
-
219
-
220
-
221
-
222
-
223
-
224
-
225
-
226
-
227
-
228
-
229
-
230
-
231
-
232
-
233
-
234
-
235
-
236
-
237
-
238
-
239
-
240
-
241
-
242
-
243
-
244
-
245
-
246
-
247
-
248
-
249
-
250
-
251
-
 252
252 -
 253
253 -
 254
254 -
 255
255 -
 256
256 -
 257
257 -
 258
258 -
 259
259 -
 260
260 -
 261
261 -
 262
262 -
 263
263 -
 264
264 -
 265
265 -
 266
266 -
 267
267 -
 268
268 -
 269
269 -
 270
270 -
 271
271 -
 272
272 -
273
-
274
-
275
-
276
-
277
-
278
-
279
-
280
-
281
-
282
-
283
-
284
-
285
-
286
-
287
-
288
-
289
-
290
-
291
-
292
-
293
-
294
-
295
-
296
-
297
-
298
-
299
-
300
-
301
-
302
-
303
-
304
-
305
-
306
-
307
-
308
 |
 |

PART II
242
DUKE ENERGY CORPORATION • DUKE ENERGY CAROLINAS, LLC • PROGRESS ENERGY, INC. • CAROLINA POWER & LIGHT COMPANY d/b/a PROGRESS ENERGY
CAROLINAS, INC. • FLORIDA POWER CORPORATION d/b/a PROGRESS ENERY FLORIDA, INC. • DUKE ENERGY OHIO, INC. • DUKE ENERGY INDIANA, INC.
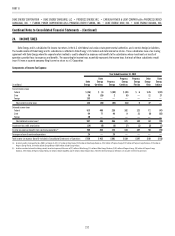
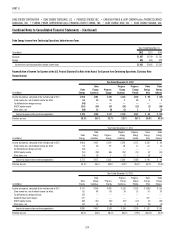
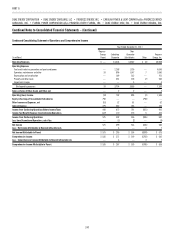
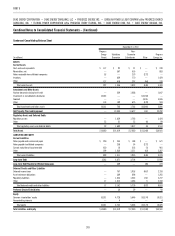
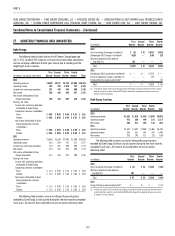
Combined Notes to Consolidated Financial Statements – (Continued)
Condensed Consolidating Balance Sheet
December 31, 2012
(in millions)
Progress
Energy
Parent
Subsidiary
Guarantor
Non-
Guarantor
Subsidiaries Other
Progress
Energy, Inc.
ASSETS
Current Assets
Cash and cash equivalents $ 63 $ 149 $ 19 $ — $ 231
Receivables, net — 321 470 (1) 790
Notes receivable from affi liated companies 603 223 162 (988) —
Inventory — 613 828 — 1,441
Other 73 393 470 (155) 781
Total current assets 739 1,699 1,949 (1,144) 3,243
Investments and Other Assets
Nuclear decommissioning trust funds — 629 1,259 — 1,888
Investment in consolidated subsidiaries 14,238 — — (14,238) —
Goodwill — — — 3,655 3,655
Other 183 228 694 (575) 530
Total investments and other assets 14,421 857 1,953 (11,158) 6,073
Net Property, Plant and Equipment — 9,362 13,190 145 22,697
Regulatory Assets and Deferred Debits
Regulatory assets — 3,321 1,971 — 5,292
Other 23 55 28 (6) 100
Total regulatory assets and deferred debits 23 3,376 1,999 (6) 5,392
Total Assets $15,183 $15,294 $19,091 $(12,163) $37,405
LIABILITIES AND EQUITY
Current Liabilities
Notes payable to affi liated companies $ 840 $ 235 $ 368 $ (988) $ 455
Current maturities of long-term debt — 435 407 1 843
Other 147 1,098 1,398 (154) 2,489
Total current liabilities 987 1,768 2,173 (1,141) 3,787
Long-term Debt 3,992 4,885 4,433 1 13,311
Long-term Debt Payable to Affi liated Companies — 309 — (35) 274
Deferred Credits and Other Liabilities
Deferred income taxes — 932 2,162 (536) 2,558
Asset retirement obligations — 764 1,649 — 2,413
Regulatory liabilities — 787 1,538 144 2,469
Other 23 943 1,375 (26) 2,315
Total deferred credits and other liabilities 23 3,426 6,724 (418) 9,755
Preferred Stock of Subsidiaries — 34 59 — 93
Equity
Common shareholders’ equity 10,181 4,868 5,702 (10,570) 10,181
Noncontrolling interests —4—— 4
Total equity 10,181 4,872 5,702 (10,570) 10,185
Total Liabilities and Equity $15,183 $15,294 $19,091 $(12,163) $37,405