Duke Energy 2012 Annual Report Download - page 184
Download and view the complete annual report
Please find page 184 of the 2012 Duke Energy annual report below. You can navigate through the pages in the report by either clicking on the pages listed below, or by using the keyword search tool below to find specific information within the annual report.-
 1
1 -
2
-
3
-
4
-
5
-
6
-
7
-
8
-
9
-
10
-
11
-
12
-
13
-
14
-
15
-
16
-
17
-
18
-
19
-
20
-
21
-
22
-
23
-
24
-
25
-
26
-
27
-
28
-
29
-
30
-
31
-
32
-
33
-
34
-
35
-
36
-
37
-
38
-
39
-
40
-
41
-
42
-
43
-
44
-
45
-
46
-
47
-
48
-
49
-
50
-
51
-
52
-
53
-
54
-
55
-
56
-
57
-
58
-
59
-
60
-
61
-
62
-
63
-
64
-
65
-
66
-
67
-
68
-
69
-
70
-
71
-
72
-
73
-
74
-
75
-
76
-
77
-
78
-
79
-
80
-
81
-
82
-
83
-
84
-
85
-
86
-
87
-
88
-
89
-
90
-
91
-
92
-
93
-
94
-
95
-
96
-
97
-
98
-
99
-
100
-
101
-
102
-
103
-
104
-
105
-
106
-
107
-
108
-
109
-
110
-
111
-
112
-
113
-
114
-
115
-
116
-
117
-
118
-
119
-
120
-
121
-
122
-
123
-
124
-
125
-
126
-
127
-
128
-
129
-
130
-
131
-
132
-
133
-
134
-
135
-
136
-
137
-
138
-
139
-
140
-
141
-
142
-
143
-
144
-
145
-
146
-
147
-
148
-
149
-
150
-
151
-
152
-
153
-
154
-
155
-
156
-
157
-
158
-
159
-
160
-
161
-
162
-
163
-
164
-
165
-
166
-
167
-
168
-
169
-
170
-
171
-
172
-
173
-
 174
174 -
 175
175 -
 176
176 -
 177
177 -
 178
178 -
 179
179 -
 180
180 -
 181
181 -
 182
182 -
 183
183 -
 184
184 -
 185
185 -
 186
186 -
 187
187 -
 188
188 -
 189
189 -
 190
190 -
 191
191 -
 192
192 -
 193
193 -
 194
194 -
195
-
196
-
197
-
198
-
199
-
200
-
201
-
202
-
203
-
204
-
205
-
206
-
207
-
208
-
209
-
210
-
211
-
212
-
213
-
214
-
215
-
216
-
217
-
218
-
219
-
220
-
221
-
222
-
223
-
224
-
225
-
226
-
227
-
228
-
229
-
230
-
231
-
232
-
233
-
234
-
235
-
236
-
237
-
238
-
239
-
240
-
241
-
242
-
243
-
244
-
245
-
246
-
247
-
248
-
249
-
250
-
251
-
252
-
253
-
254
-
255
-
256
-
257
-
258
-
259
-
260
-
261
-
262
-
263
-
264
-
265
-
266
-
267
-
268
-
269
-
270
-
271
-
272
-
273
-
274
-
275
-
276
-
277
-
278
-
279
-
280
-
281
-
282
-
283
-
284
-
285
-
286
-
287
-
288
-
289
-
290
-
291
-
292
-
293
-
294
-
295
-
296
-
297
-
298
-
299
-
300
-
301
-
302
-
303
-
304
-
305
-
306
-
307
-
308
 |
 |

164
PART II
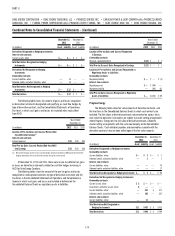
Combined Notes to Consolidated Financial Statements – (Continued)
DUKE ENERGY CORPORATION • DUKE ENERGY CAROLINAS, LLC • PROGRESS ENERGY, INC. • CAROLINA POWER & LIGHT COMPANY d/b/a PROGRESS ENERGY
CAROLINAS, INC. • FLORIDA POWER CORPORATION d/b/a PROGRESS ENERY FLORIDA, INC. • DUKE ENERGY OHIO, INC. • DUKE ENERGY INDIANA, INC.
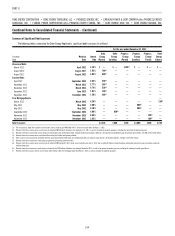
December 31, 2011
(in millions)
Estimated
Useful Life Duke Energy
Duke Energy
Carolinas
Progress
Energy
Progress Energy
Carolinas
Progress Energy
Florida
Duke Energy
Ohio
Duke Energy
Indiana
(Years)
Land $ 745 $ 372 $ 595 $ 367 $ 228 $ 135 $ 88
Plant — Regulated
Electric generation, distribution and transmission 2–138 38,171 26,307 28,824 16,078 12,546 3,595 8,269
Natural gas transmission and distribution 12–60 1,927 — — — — 1,927 —
Other buildings and improvements 9–100 672 428 473 138 327 106 138
Plant — Unregulated
Electric generation, distribution and transmission 2–100 5,464 — — — — 3,997 —
Other buildings and improvements 9–44 2,095 — — — — 192 —
Nuclear fuel 1,213 1,213 1,161 862 299 — —
Equipment 3–33 863 248 553 318 82 168 134
Construction in process 7,664 3,774 2,454 1,294 1,155 255 2,992
Other 5–60 2,476 498 753 326 289 257 170
Total property, plant and equipment(a) 61,290 32,840 34,813 19,383 14,926 10,632 11,791
Total accumulated depreciation — regulated(b)(c)(d) (16,550) (11,269) (12,684) (7,991) (4,474) (1,916) (3,393)
Total accumulated depreciation — unregulated(c)(d) (2,159) — — — — (678) —
Generation facilities to be retired, net 80 80 163 163 — — —
Total net property, plant and equipment $ 42,661 $ 21,651 $ 22,292 $11,555 $10,452 $ 8,038 $ 8,398
(a) Includes capitalized leases of $444 million, $53 million, $211 million, $12 million, $199 million, $82 million, and $33 million at Duke Energy, Duke Energy Carolinas, Progress Energy, Progress Energy Carolinas, Progress
Energy Florida, Duke Energy Ohio, and Duke Energy Indiana, respectively. The Progress Energy, Progress Energy Carolinas and Progress Energy Florida amounts are net of $56 million, $18 million and $38 million, respectively,
of accumulated amortization of capitalized leases.
(b) Includes $578 million, $578 million, $394 million, $322 million and $72 million of accumulated amortization of nuclear fuel at Duke Energy, Duke Energy Carolinas, Progress Energy, Progress Energy Carolinas and Progress
Energy Florida, respectively.
(c) Includes accumulated amortization of capitalized leases of $28 million, an insignifi cant amount, $11 million and $6 million at Duke Energy, Duke Energy Carolinas, Duke Energy Ohio, and Duke Energy Indiana, respectively.
(d) Includes accumulated depreciation of VIEs of $62 million and an insignifi cant amount at December 31, 2011 at Duke Energy and Progress Energy, respectively.
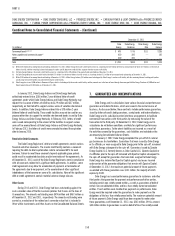
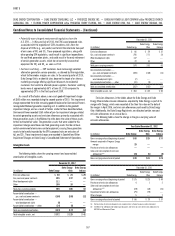
The following table presents capitalized interest, which includes the debt component of AFUDC.
Years Ended December 31,
(in millions) 2012 2011 2010
Duke Energy $177 $166 $167
Duke Energy Carolinas 72 78 83
Progress Energy 41 35 32
Progress Energy Carolinas 23 20 19
Progress Energy Florida 18 15 13
Duke Energy Ohio 15 9 8
Duke Energy Indiana 39 33 19