Duke Energy 2012 Annual Report Download - page 62
Download and view the complete annual report
Please find page 62 of the 2012 Duke Energy annual report below. You can navigate through the pages in the report by either clicking on the pages listed below, or by using the keyword search tool below to find specific information within the annual report.-
 1
1 -
2
-
3
-
4
-
5
-
6
-
7
-
8
-
9
-
10
-
11
-
12
-
13
-
14
-
15
-
16
-
17
-
18
-
19
-
20
-
21
-
22
-
23
-
24
-
25
-
26
-
27
-
28
-
29
-
30
-
31
-
32
-
33
-
34
-
35
-
36
-
37
-
38
-
39
-
40
-
41
-
42
-
43
-
44
-
45
-
46
-
47
-
48
-
49
-
50
-
51
-
 52
52 -
 53
53 -
 54
54 -
 55
55 -
 56
56 -
 57
57 -
 58
58 -
 59
59 -
 60
60 -
 61
61 -
 62
62 -
 63
63 -
 64
64 -
 65
65 -
 66
66 -
 67
67 -
 68
68 -
 69
69 -
 70
70 -
 71
71 -
 72
72 -
73
-
74
-
75
-
76
-
77
-
78
-
79
-
80
-
81
-
82
-
83
-
84
-
85
-
86
-
87
-
88
-
89
-
90
-
91
-
92
-
93
-
94
-
95
-
96
-
97
-
98
-
99
-
100
-
101
-
102
-
103
-
104
-
105
-
106
-
107
-
108
-
109
-
110
-
111
-
112
-
113
-
114
-
115
-
116
-
117
-
118
-
119
-
120
-
121
-
122
-
123
-
124
-
125
-
126
-
127
-
128
-
129
-
130
-
131
-
132
-
133
-
134
-
135
-
136
-
137
-
138
-
139
-
140
-
141
-
142
-
143
-
144
-
145
-
146
-
147
-
148
-
149
-
150
-
151
-
152
-
153
-
154
-
155
-
156
-
157
-
158
-
159
-
160
-
161
-
162
-
163
-
164
-
165
-
166
-
167
-
168
-
169
-
170
-
171
-
172
-
173
-
174
-
175
-
176
-
177
-
178
-
179
-
180
-
181
-
182
-
183
-
184
-
185
-
186
-
187
-
188
-
189
-
190
-
191
-
192
-
193
-
194
-
195
-
196
-
197
-
198
-
199
-
200
-
201
-
202
-
203
-
204
-
205
-
206
-
207
-
208
-
209
-
210
-
211
-
212
-
213
-
214
-
215
-
216
-
217
-
218
-
219
-
220
-
221
-
222
-
223
-
224
-
225
-
226
-
227
-
228
-
229
-
230
-
231
-
232
-
233
-
234
-
235
-
236
-
237
-
238
-
239
-
240
-
241
-
242
-
243
-
244
-
245
-
246
-
247
-
248
-
249
-
250
-
251
-
252
-
253
-
254
-
255
-
256
-
257
-
258
-
259
-
260
-
261
-
262
-
263
-
264
-
265
-
266
-
267
-
268
-
269
-
270
-
271
-
272
-
273
-
274
-
275
-
276
-
277
-
278
-
279
-
280
-
281
-
282
-
283
-
284
-
285
-
286
-
287
-
288
-
289
-
290
-
291
-
292
-
293
-
294
-
295
-
296
-
297
-
298
-
299
-
300
-
301
-
302
-
303
-
304
-
305
-
306
-
307
-
308
 |
 |

42
PART II
Partially offsetting these increases was:
• A $27 million decrease in Ecuador due to lower fuel consumption as a
result of lower dispatch, and lower maintenance costs.
Other Income and Expense, net.
The variance was primarily driven by a $44 million increase in equity
earnings from NMC due to higher average prices partially offset by higher butane
costs, and a $20 million arbitration award in Peru.
Interest Expense.
The variance was primarily a result of infl ation impact in Brazil and lower
interest expense in Central America due to prepayment of debt.
Income Tax Expense.
The variance is primarily due to an increase in pretax income. The
effective tax rate for the year ended December 31, 2011 and 2010 was 28.9%
and 31.1%, respectively.
Segment Income.
As discussed above, the variance was primarily due to favorable contract
prices and exchange rates in Brazil, arbitration award and higher margins in Peru,
favorable hydrology in Central America, and higher equity earnings at NMC.
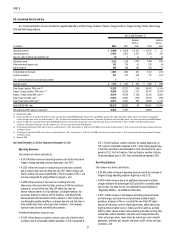
Other
Years Ended December 31,
(in millions) 2012 2011
Variance
2012 vs.
2011 2010
Variance
2011 vs.
2010
Operating revenues $74 $44 $ 30 $ 142 $ (98)
Operating expenses 704 133 571 389 (256)
(Losses) gains on sales of other assets and other, net (7) (8) 1 145 (153)
Operating loss (637) (97) (540) (102) 5
Other income and expense, net 16 49 (33) 126 (77)
Interest expense 297 157 140 136 21
Loss before income taxes (918) (205) (713) (112) (93)
Income tax benefi t (378) (114) (264) (62) (52)
Less: Loss attributable to noncontrolling interests (2) (15) 13 (9) (6)
Net expense $(538) $ (76) $(462) $ (41) $ (35)
Year Ended December 31, 2012 as Compared to December 31, 2011
Operating Revenues.
The variance was driven primarily by higher premiums earned at Bison
Insurance Company Limited (Bison) as a result of the addition of Progress Energy
and mark-to-market activity at Duke Energy Trading and Marketing, LLC (DETM).
Operating Expenses.
The variance was driven primarily by charges related to the Progress
Energy merger, increased severance costs and higher current year donations.
These negative impacts were partially offset by higher JV costs related to DETM
in the prior year.
Other Income and Expense, net.
The variance was driven primarily by current year impairments and
prior year gains on sales of investments, higher interest income recorded in
2011 following the resolution of certain income tax matters related to prior
years and reversal of reserves related to certain guarantees Duke Energy had
issued on behalf of Crescent in 2011. These negative impacts were partially
offset by higher returns on investments that support benefi t obligations in 2012
compared to 2011.
Interest Expense.
The variance was due primarily to higher debt balances as a result of debt
issuances and the inclusion of Progress Energy interest expense beginning in
July 2012.
Income Tax Benefi t.
The variance is primarily due to an increase in pretax loss. The effective
tax rate for the years ended December 31, 2012 and 2011 was 41.1% and
56.0%, respectively.
Net Expense.
The variance was due primarily to charges related to the Progress Energy
merger, increased severance costs, and higher interest expense. These negative
impacts were partially offset by higher income tax benefi t due to increased net
expense and higher returns on investments that support benefi t obligations in
2012 compared to 2011.
Year Ended December 31, 2011 as Compared to December 31, 2010
Operating Revenues.
The variance was driven primarily by the deconsolidation of DukeNet in
December 2010 and the subsequent accounting for Duke Energy’s investment in
DukeNet as an equity method investment.
Operating Expenses.
The variance was driven primarily by $172 million of 2010 employee
severance costs related to the voluntary severance plan and the consolidation of
certain corporate offi ce functions from the Midwest to Charlotte, North Carolina,
prior year donations of $56 million to the Duke Energy Foundation, which
is a nonprofi t organization funded by Duke Energy shareholders that makes
charitable contributions to selected nonprofi ts and government subdivisions,