Duke Energy 2012 Annual Report Download - page 269
Download and view the complete annual report
Please find page 269 of the 2012 Duke Energy annual report below. You can navigate through the pages in the report by either clicking on the pages listed below, or by using the keyword search tool below to find specific information within the annual report.-
 1
1 -
2
-
3
-
4
-
5
-
6
-
7
-
8
-
9
-
10
-
11
-
12
-
13
-
14
-
15
-
16
-
17
-
18
-
19
-
20
-
21
-
22
-
23
-
24
-
25
-
26
-
27
-
28
-
29
-
30
-
31
-
32
-
33
-
34
-
35
-
36
-
37
-
38
-
39
-
40
-
41
-
42
-
43
-
44
-
45
-
46
-
47
-
48
-
49
-
50
-
51
-
52
-
53
-
54
-
55
-
56
-
57
-
58
-
59
-
60
-
61
-
62
-
63
-
64
-
65
-
66
-
67
-
68
-
69
-
70
-
71
-
72
-
73
-
74
-
75
-
76
-
77
-
78
-
79
-
80
-
81
-
82
-
83
-
84
-
85
-
86
-
87
-
88
-
89
-
90
-
91
-
92
-
93
-
94
-
95
-
96
-
97
-
98
-
99
-
100
-
101
-
102
-
103
-
104
-
105
-
106
-
107
-
108
-
109
-
110
-
111
-
112
-
113
-
114
-
115
-
116
-
117
-
118
-
119
-
120
-
121
-
122
-
123
-
124
-
125
-
126
-
127
-
128
-
129
-
130
-
131
-
132
-
133
-
134
-
135
-
136
-
137
-
138
-
139
-
140
-
141
-
142
-
143
-
144
-
145
-
146
-
147
-
148
-
149
-
150
-
151
-
152
-
153
-
154
-
155
-
156
-
157
-
158
-
159
-
160
-
161
-
162
-
163
-
164
-
165
-
166
-
167
-
168
-
169
-
170
-
171
-
172
-
173
-
174
-
175
-
176
-
177
-
178
-
179
-
180
-
181
-
182
-
183
-
184
-
185
-
186
-
187
-
188
-
189
-
190
-
191
-
192
-
193
-
194
-
195
-
196
-
197
-
198
-
199
-
200
-
201
-
202
-
203
-
204
-
205
-
206
-
207
-
208
-
209
-
210
-
211
-
212
-
213
-
214
-
215
-
216
-
217
-
218
-
219
-
220
-
221
-
222
-
223
-
224
-
225
-
226
-
227
-
228
-
229
-
230
-
231
-
232
-
233
-
234
-
235
-
236
-
237
-
238
-
239
-
240
-
241
-
242
-
243
-
244
-
245
-
246
-
247
-
248
-
249
-
250
-
251
-
252
-
253
-
254
-
255
-
256
-
257
-
258
-
 259
259 -
 260
260 -
 261
261 -
 262
262 -
 263
263 -
 264
264 -
 265
265 -
 266
266 -
 267
267 -
 268
268 -
 269
269 -
 270
270 -
 271
271 -
 272
272 -
 273
273 -
 274
274 -
 275
275 -
 276
276 -
 277
277 -
 278
278 -
 279
279 -
280
-
281
-
282
-
283
-
284
-
285
-
286
-
287
-
288
-
289
-
290
-
291
-
292
-
293
-
294
-
295
-
296
-
297
-
298
-
299
-
300
-
301
-
302
-
303
-
304
-
305
-
306
-
307
-
308
 |
 |

PART II
249
DUKE ENERGY CORPORATION • DUKE ENERGY CAROLINAS, LLC • PROGRESS ENERGY, INC. • CAROLINA POWER & LIGHT COMPANY d/b/a PROGRESS ENERGY
CAROLINAS, INC. • FLORIDA POWER CORPORATION d/b/a PROGRESS ENERY FLORIDA, INC. • DUKE ENERGY OHIO, INC. • DUKE ENERGY INDIANA, INC
.
Combined Notes to Consolidated Financial Statements – (Continued)
Progress Energy Florida
(in millions)
First
Quarter
Second
Quarter
Third
Quarter
Fourth
Quarter Total
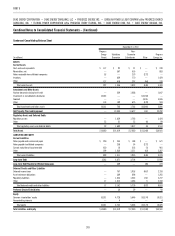
2012
Operating revenues $1,010 $1,196 $1,388 $1,095 $4,689
Operating income (loss) 255 196 207 (29) 629
Net income (loss) 128 83 100 (45) 266
2011
Operating revenues $1,037 $1,199 $1,419 $ 737 $4,392
Operating income (loss) 216 236 363 (112) 703
Net income (loss) 102 113 203 (104) 314
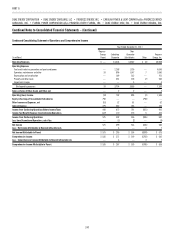
The following table includes unusual or infrequently occurring items
recorded by Progress Energy Florida in each quarter during the two most
recently completed fi scal years. All amounts discussed below are pre-tax unless
otherwise noted.
(in millions)
First
Quarter
Second
Quarter
Third
Quarter
Fourth
Quarter
2012
Costs to achieve the merger (see Note 2) $ (3) $ (8) $ (37) $ (46)
Florida replacement power refund (see Note 4) — — (100) —
Charges related to decision to retire Crystal
River Unit 3 (see Note 4) — — — (192)
Total $ (3) $ (8) $(137) $(238)
2011
Florida customer refund (see Note 4) $— $— $ — $(288)
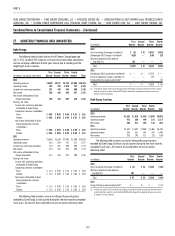
Duke Energy Ohio
(in millions)
First
Quarter
Second
Quarter
Third
Quarter
Fourth
Quarter Total
2012
Operating revenues $912 $717 $757 $766 $3,152
Operating income 138 95 42 74 349
Net income 74 45 14 42 175
2011
Operating revenues $879 $ 694 $838 $770 $3,181
Operating income 135 59 116 65 375
Net income 73 33 51 37 194
The following table includes unusual or infrequently occurring items
recorded by Duke Energy Ohio in each quarter during the two most recently
completed fi scal years. All amounts discussed below are pre-tax unless
otherwise noted.
(in millions)
First
Quarter
Second
Quarter
Third
Quarter
Fourth
Quarter
2012
Costs to achieve the merger (see Note 2) $ (1) $ (1) $(22) $(12)
2011
Emission allowance charges (see Note 12) $— $— $ (79) $ —
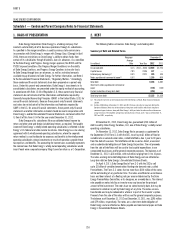
Duke Energy Indiana
(in millions)
First
Quarter
Second
Quarter
Third
Quarter
Fourth
Quarter Total
2012
Operating revenues $ 688 $685 $718 $626 $2,717
Operating (loss) income (272) 134 (30) 93 (75)
Net (loss) income (167) 77 (19) 59 (50)
2011
Operating revenues $ 659 $620 $718 $625 $2,622
Operating income (loss) 130 109 (42) 85 282
Net income (loss) 76 68 (31) 55 168
The following table includes unusual or infrequently occurring items
recorded by Duke Energy Indiana in each quarter during the two most recently
completed fi scal years. All amounts discussed below are pre-tax unless
otherwise noted.
(in millions)
First
Quarter
Second
Quarter
Third
Quarter
Fourth
Quarter
2012
Costs to achieve the merger (see Note 2) $ (1) $ (1) $ (21) $(11)
Edwardsport IGCC charges (see Note 4) (420) — (180) (28)
Total $(421) $ (1) $(201) $ (39)
2011
Edwardsport IGCC impairment (see Note 4) $ — $— $(222) $ —