Duke Energy 2012 Annual Report Download - page 28
Download and view the complete annual report
Please find page 28 of the 2012 Duke Energy annual report below. You can navigate through the pages in the report by either clicking on the pages listed below, or by using the keyword search tool below to find specific information within the annual report.-
 1
1 -
2
-
3
-
4
-
5
-
6
-
7
-
8
-
9
-
10
-
11
-
12
-
13
-
14
-
15
-
16
-
17
-
 18
18 -
 19
19 -
 20
20 -
 21
21 -
 22
22 -
 23
23 -
 24
24 -
 25
25 -
 26
26 -
 27
27 -
 28
28 -
 29
29 -
 30
30 -
 31
31 -
 32
32 -
 33
33 -
 34
34 -
 35
35 -
 36
36 -
 37
37 -
 38
38 -
39
-
40
-
41
-
42
-
43
-
44
-
45
-
46
-
47
-
48
-
49
-
50
-
51
-
52
-
53
-
54
-
55
-
56
-
57
-
58
-
59
-
60
-
61
-
62
-
63
-
64
-
65
-
66
-
67
-
68
-
69
-
70
-
71
-
72
-
73
-
74
-
75
-
76
-
77
-
78
-
79
-
80
-
81
-
82
-
83
-
84
-
85
-
86
-
87
-
88
-
89
-
90
-
91
-
92
-
93
-
94
-
95
-
96
-
97
-
98
-
99
-
100
-
101
-
102
-
103
-
104
-
105
-
106
-
107
-
108
-
109
-
110
-
111
-
112
-
113
-
114
-
115
-
116
-
117
-
118
-
119
-
120
-
121
-
122
-
123
-
124
-
125
-
126
-
127
-
128
-
129
-
130
-
131
-
132
-
133
-
134
-
135
-
136
-
137
-
138
-
139
-
140
-
141
-
142
-
143
-
144
-
145
-
146
-
147
-
148
-
149
-
150
-
151
-
152
-
153
-
154
-
155
-
156
-
157
-
158
-
159
-
160
-
161
-
162
-
163
-
164
-
165
-
166
-
167
-
168
-
169
-
170
-
171
-
172
-
173
-
174
-
175
-
176
-
177
-
178
-
179
-
180
-
181
-
182
-
183
-
184
-
185
-
186
-
187
-
188
-
189
-
190
-
191
-
192
-
193
-
194
-
195
-
196
-
197
-
198
-
199
-
200
-
201
-
202
-
203
-
204
-
205
-
206
-
207
-
208
-
209
-
210
-
211
-
212
-
213
-
214
-
215
-
216
-
217
-
218
-
219
-
220
-
221
-
222
-
223
-
224
-
225
-
226
-
227
-
228
-
229
-
230
-
231
-
232
-
233
-
234
-
235
-
236
-
237
-
238
-
239
-
240
-
241
-
242
-
243
-
244
-
245
-
246
-
247
-
248
-
249
-
250
-
251
-
252
-
253
-
254
-
255
-
256
-
257
-
258
-
259
-
260
-
261
-
262
-
263
-
264
-
265
-
266
-
267
-
268
-
269
-
270
-
271
-
272
-
273
-
274
-
275
-
276
-
277
-
278
-
279
-
280
-
281
-
282
-
283
-
284
-
285
-
286
-
287
-
288
-
289
-
290
-
291
-
292
-
293
-
294
-
295
-
296
-
297
-
298
-
299
-
300
-
301
-
302
-
303
-
304
-
305
-
306
-
307
-
308
 |
 |

PART I
8
support; adequate fi nancial cost-recovery mechanisms; appropriate levels of
joint owner participation; customer rate impacts; project feasibility; demand
side management (DSM) and energy effi ciency (EE) programs; and availability
and terms of capital fi nancing. Taking into account these criteria, Levy is
considered to be Progress Energy Florida’s preferred baseload generation
option.
Under the terms of the 2012 FSPC Settlement Agreement, Progress
Energy Florida began residential cost-recovery of its proposed Levy Nuclear
Station effective in the fi rst billing cycle of January 2013 at the fi xed rates
contained in the settlement and continuing for a fi ve-year period, with true-up
of any actual costs not recovered during the fi ve year period occurring in the
fi nal year. Progress Energy Florida will not fi le for recovery of any new Levy
costs that were not addressed in the 2012 FSPC Settlement Agreement before
March 1, 2017 and will not begin recovering those costs from customers
before the fi rst billing cycle of January, 2018, unless otherwise agreed to by
the parties to the agreement. This amount is intended to recover the estimated
retail project costs to date plus costs necessary to obtain the COL and any
engineering, procurement and construction cancellation costs, if Progress
Energy Florida ultimately chooses to cancel that contract. In addition, the
consumer parties will not oppose Progress Energy Florida continuing to pursue a
COL for Levy. The 2012 FSPC Settlement Agreement also provides that Progress
Energy Florida will treat the allocated wholesale cost of Levy (approximately
$68 million) as a retail regulatory asset and include this asset as a component
of rate base and amortization expense for regulatory reporting. Progress Energy
Florida will have the discretion to accelerate and/or suspend such amortization
in full or in part provided that it amortizes all of the regulatory asset by
December 31, 2016.
William States Lee III Nuclear Station.
In December 2007, Duke Energy Carolinas fi led an application with
the NRC, which has been docketed for review, for a combined COL for two
Westinghouse AP1000 reactors for the proposed William States Lee III Nuclear
Station (Lee Nuclear Station) at a site in Cherokee County, South Carolina.
Each reactor is capable of producing 1,117 MW. Submitting the COL application
does not commit Duke Energy Carolinas to build nuclear units. Through several
separate orders, the NCUC and PSCSC have concurred with the prudency of
Duke Energy incurring project development and pre-construction costs.
Potential Plant Retirements.
The Subsidiary Registrants periodically fi le Integrated Resource Plans (IRP)
with their state regulatory commissions. The IRPs provide a view of forecasted
energy needs over a long term (15-20 years), and options being considered to
meet those needs. The IRP’s fi led by the Subsidiary Registrants in 2012 and
2011 included planning assumptions to potentially retire by 2015, certain coal-
fi red generating facilities in North Carolina, South Carolina, Indiana and Ohio
that do not have the requisite emission control equipment, primarily to meet
Environmental Protection Agency (EPA) regulations that are not yet effective.
Additionally, management is considering the impact pending environmental
regulations might have on certain coal-fi red generating facilities in Florida. These
facilities total approximately 3,954 MW at eight sites. Duke Energy continues to
evaluate the potential need to retire these coal-fi red generating facilities earlier
than the current estimated useful lives, and plans to seek regulatory recovery
for amounts that would not be otherwise recovered when any assets are retired.
For additional information related to potential plant retirements see Note 4 to the
Consolidated Financial Statements, “Regulatory Matters.”
Fuel Supply
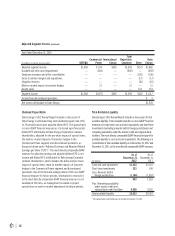
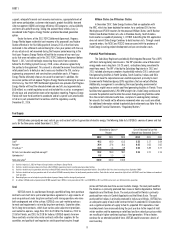
USFE&G relies principally on coal, natural gas and nuclear fuel for its generation of electric energy. The following table lists USFE&G’s sources of power and fuel
costs for the three years ended December 31, 2012.
Generation by Source(a)
Percent
Cost of Delivered Fuel per Net
Kilowatt-hour Generated (Cents)(a)
2012 2011 2010 2012 2011 2010
Coal(b) 46.2 60.0 61.5 3.55 3.17 3.04
Nuclear(c) 36.4 37.6 36.3 0.62 0.55 0.52
Oil and gas(d) 16.6 1.4 0.9 4.03 5.89 6.77
All fuels (cost-based on weighted average)(b) 99.2 99.0 98.7 2.55 2.21 2.15
Hydroelectric(e) 0.8 1.0 1.3
Total generation(f) 100.0 100.0 100.0
(a) Statistics begin July 2, 2012 for Progress Energy Carolinas and Progress Energy Florida.
(b) Statistics related to coal generation and all fuels refl ect USFE&G’s ownership interest in jointly owned generation facilities.
(c) Statistics related to nuclear generation and all fuels refl ect USFE&G’s ownership interest in jointly owned generation facilities. (Crystal River Unit 3 has been in an outage since September 2009)
(d) Statistics related to oil and gas generation and all fuels refl ect USFE&G’s ownership interest in jointly owned generation facilities. Cost statistics include amounts for light-off fuel at USFE&G’s coal-fi red stations and combined
cycle (gas only).
(e) Generating fi gures are net of output required to replenish pumped storage facilities during off-peak periods.
(f) In addition, USFE&G produced approximately 10,500 megawatt-hours (MWh) in solar generation for 2012, and 5,800 MWh in 2011 and 2010; no fuel costs are attributed to this generation.
Coal.
USFE&G meets its coal demand through a portfolio of long-term purchase
contracts and short-term spot market purchase agreements. Large amounts of
coal are purchased under long-term contracts with mining operators who mine
both underground and at the surface. USFE&G uses spot-market purchases
to meet coal requirements not met by long-term contracts. Expiration dates
for its long-term contracts, which have various price adjustment provisions
and market re-openers, range from 2013 to 2018 for the Carolinas, 2013 to
2016 for Florida, and 2013 to 2018 for Indiana. USFE&G expects to renew
these contracts or enter into similar contracts with other suppliers for the
quantities and quality of coal required as existing contracts expire, though
prices will fl uctuate over time as coal markets change. The coal purchased for
the Carolinas is primarily produced from mines in Central Appalachia, Northern
Appalachia and the Illinois Basin. The coal purchased for Florida is primarily
produced from mines in Central Appalachia and the Illinois Basin. The coal
purchased for Indiana is primarily produced in Indiana and Illinois. USFE&G has
an adequate supply of coal under contract to fuel its projected 2013 operations
and a signifi cant portion of supply to fuel its projected 2014 operations. Coal
inventory levels have increased during the past year due to the impact of mild
winter weather and the economy on retail load and low natural gas prices which
are resulting in higher combined cycle gas-fi red generation. If these factors
continue for an extended period of time, USFE&G could have excess levels of
coal inventory.