Duke Energy 2012 Annual Report Download - page 54
Download and view the complete annual report
Please find page 54 of the 2012 Duke Energy annual report below. You can navigate through the pages in the report by either clicking on the pages listed below, or by using the keyword search tool below to find specific information within the annual report.-
 1
1 -
2
-
3
-
4
-
5
-
6
-
7
-
8
-
9
-
10
-
11
-
12
-
13
-
14
-
15
-
16
-
17
-
18
-
19
-
20
-
21
-
22
-
23
-
24
-
25
-
26
-
27
-
28
-
29
-
30
-
31
-
32
-
33
-
34
-
35
-
36
-
37
-
38
-
39
-
40
-
41
-
42
-
43
-
 44
44 -
 45
45 -
 46
46 -
 47
47 -
 48
48 -
 49
49 -
 50
50 -
 51
51 -
 52
52 -
 53
53 -
 54
54 -
 55
55 -
 56
56 -
 57
57 -
 58
58 -
 59
59 -
 60
60 -
 61
61 -
 62
62 -
 63
63 -
 64
64 -
65
-
66
-
67
-
68
-
69
-
70
-
71
-
72
-
73
-
74
-
75
-
76
-
77
-
78
-
79
-
80
-
81
-
82
-
83
-
84
-
85
-
86
-
87
-
88
-
89
-
90
-
91
-
92
-
93
-
94
-
95
-
96
-
97
-
98
-
99
-
100
-
101
-
102
-
103
-
104
-
105
-
106
-
107
-
108
-
109
-
110
-
111
-
112
-
113
-
114
-
115
-
116
-
117
-
118
-
119
-
120
-
121
-
122
-
123
-
124
-
125
-
126
-
127
-
128
-
129
-
130
-
131
-
132
-
133
-
134
-
135
-
136
-
137
-
138
-
139
-
140
-
141
-
142
-
143
-
144
-
145
-
146
-
147
-
148
-
149
-
150
-
151
-
152
-
153
-
154
-
155
-
156
-
157
-
158
-
159
-
160
-
161
-
162
-
163
-
164
-
165
-
166
-
167
-
168
-
169
-
170
-
171
-
172
-
173
-
174
-
175
-
176
-
177
-
178
-
179
-
180
-
181
-
182
-
183
-
184
-
185
-
186
-
187
-
188
-
189
-
190
-
191
-
192
-
193
-
194
-
195
-
196
-
197
-
198
-
199
-
200
-
201
-
202
-
203
-
204
-
205
-
206
-
207
-
208
-
209
-
210
-
211
-
212
-
213
-
214
-
215
-
216
-
217
-
218
-
219
-
220
-
221
-
222
-
223
-
224
-
225
-
226
-
227
-
228
-
229
-
230
-
231
-
232
-
233
-
234
-
235
-
236
-
237
-
238
-
239
-
240
-
241
-
242
-
243
-
244
-
245
-
246
-
247
-
248
-
249
-
250
-
251
-
252
-
253
-
254
-
255
-
256
-
257
-
258
-
259
-
260
-
261
-
262
-
263
-
264
-
265
-
266
-
267
-
268
-
269
-
270
-
271
-
272
-
273
-
274
-
275
-
276
-
277
-
278
-
279
-
280
-
281
-
282
-
283
-
284
-
285
-
286
-
287
-
288
-
289
-
290
-
291
-
292
-
293
-
294
-
295
-
296
-
297
-
298
-
299
-
300
-
301
-
302
-
303
-
304
-
305
-
306
-
307
-
308
 |
 |

34
PART II
to recover investments in Duke Energy’s ongoing infrastructure modernization
projects and operating costs. Planning for and obtaining favorable outcomes
from these regulatory proceedings are key factors in achieving Duke Energy’s
long-term growth assumptions.
Achieving Intended Merger Cost Savings and Effi ciencies. Duke
Energy is taking a disciplined and systematic approach to merger integration
work. Duke Energy is on track to achieve intended savings and effi ciencies. In
addition, through the effi cient joint dispatch of the Duke Energy Carolinas and
Progress Energy Carolinas generation fl eets, Duke Energy is ahead of schedule
in achieving fuels savings for customers in the Carolinas, achieving $52 million
in fuel costs during the fi rst six months following the merger. These savings are
passed to customers.
Management of Crystal River Unit 3 Retirement. On February 5, 2013,
following the completion of a comprehensive analysis, Duke Energy announced
its intention to retire Crystal River Unit 3. Duke Energy concluded that it did not
have a high degree of confi dence that repair could be successfully completed and
licensed within estimated costs and schedule, and that was in the best interests
of Progress Energy Florida’s customers and joint owners and Duke Energy’s
investors to retire the unit. Progress Energy Florida developed initial estimates
of the cost to decommission the plant during its analysis of whether to repair
or retire Crystal River Unit 3. With the fi nal decision to retire, Progress Energy
Florida is working to develop a comprehensive decommissioning plan, which
will evaluate various decommissioning options and costs associated with each
option. The plan will determine resource needs as well as the scope, schedule
and other elements of decommissioning. Progress Energy Florida intends to use a
safe storage (SAFSTOR) option for decommissioning. Generally, SAFSTOR involves
placing the facility into a safe storage confi guration, requiring limited staffi ng to
monitor plant conditions, until the eventual dismantling and decontamination
activities occur, usually in 40 to 60 years. This decommissioning approach is
currently utilized at a number of retired domestic nuclear power plants and is
one of three generally accepted approaches to decommissioning required by the
NRC. Additional specifi cs about the decommissioning plan are being developed.
Also on February 5, 2013, Progress Energy Florida announced it and NEIL had
accepted the mediator’s proposal whereby NEIL will pay Progress Energy Florida
an additional $530 million. Along with the $305 million which NEIL previously paid,
Progress Energy Florida will receive a total of $835 million in insurance proceeds.
Progress Energy Florida expects that the FPSC will review the prudence of the
retirement decision in Phase 2 of the Crystal River Unit 3 delamination regulatory
docket. Progress Energy Florida has also asked the FPSC to review the mediated
resolution of insurance claims with NEIL as part of Phase 3 of this regulatory
docket. Phase 2 and Phase 3 hearings have been tentatively scheduled to begin on
June 19, 2013.
Completing Remaining Major Capital Projects. Duke Energy
anticipates total capital expenditures of $5.9 billion to $6.3 billion in 2013.
Approximately $1.7 billion of these expenditures are related to expansion and
growth projects, including but not limited to, the Edwardsport IGCC plant and
the Sutton combined cycle facility. Following the completion of the Sutton
and Edwardsport facilities in 2013, the major components of Duke Energy’s fl eet
modernization program will be complete. The fl eet modernization program will
permit Duke Energy to retire up to 6,800 MW of older, less-effi cient coal-fi red
units by 2015, with approximately 3,800 MW retired by the end of 2013.
Optimizing Nuclear Fleet Performance. In 2012, Duke Energy’s
nuclear fl eet achieved a capacity factor over 90 percent, excluding Crystal River
Unit 3. Duke Energy will continue to leverage best practices across the nuclear
fl eet to maintain and improve the performance of the fl eet. To meet this goal,
targeted investments to increase overall fl eet performance and to meet the
NRC’s Fukushima-related requirements totaling $825 million are planned over
the next three years.
Economic Factors for Duke Energy’s Business
The historical and future trends of Duke Energy’s operating results have
been and will be affected in varying degrees by a number of factors, including
those discussed below. Duke Energy’s revenues depend on customer usage,
which varies with weather conditions and behavior patterns, general business
conditions and the cost of energy services. Various regulatory agencies approve
the prices for electric service within their respective jurisdictions and affect
Duke Energy’s ability to recover its costs from customers.
Declines in demand for electricity as a result of economic downturns
reduce overall electricity sales and have the potential to lessen Duke Energy’s
cash fl ows, especially if retail customers reduce consumption of electricity. A
weakening economy could also impact Duke Energy’s customers’ ability to pay,
causing increased delinquencies, slowing collections and leading to higher than
normal levels of accounts receivables, bad debts and fi nancing requirements. A
portion of USFE&G’s business risk is mitigated by its regulated allowable rates
of return and recovery of fuel costs under fuel adjustment clauses.
If negative market conditions should persist over time and estimated
cash fl ows over the lives of Duke Energy’s individual assets, including
goodwill, do not exceed the carrying value of those individual assets, asset
impairments may occur in the future under existing accounting rules and
diminish results of operations. A change in management’s intent about the
use of individual assets (held for use versus held for sale) could also result
in impairments or losses. Duke Energy evaluates the carrying amount of its
recorded goodwill for impairment on an annual basis as of August 31 and
performs interim impairment tests if a triggering event occurs that indicates it
is not more likely than not that the fair value of a reporting unit is less than its
carrying value. For further information on key assumptions that impact Duke
Energy’s goodwill impairment assessments, see “Critical Accounting Policy for
Goodwill Impairment Assessments” and Note 12 to the Consolidated Financial
Statements, “Goodwill, Intangible Assets and Impairments.”
Duke Energy’s goals for 2013 and beyond could also be substantially
at risk due to the regulation of its businesses. Duke Energy’s businesses in
the U.S. are subject to regulation on the federal and state level. Regulations,
applicable to the electric power industry, have a signifi cant impact on the nature
of the businesses and the manner in which they operate. USFE&G has four
outstanding rate cases and plans to initiate two additional rate cases in 2013.
New legislation and changes to regulations are ongoing, including anticipated
carbon legislation, and Duke Energy cannot predict the future course of changes
in the regulatory or political environment or the ultimate effect that any such
future changes will have on its business.
Duke Energy’s earnings are impacted by fl uctuations in commodity
prices. Exposure to commodity prices generates higher earnings volatility in
the unregulated businesses. To mitigate these risks, Duke Energy enters into
derivative instruments to effectively hedge some, but not all, known exposures.
Additionally, Duke Energy’s investments and projects located outside of
the U.S. expose Duke Energy to risks related to laws of other countries, taxes,
economic conditions, fl uctuations in currency rates, political conditions and
policies of foreign governments. Changes in these factors are diffi cult to predict
and may impact Duke Energy’s future results.
Duke Energy also relies on access to both short-term money markets and
longer-term capital markets as a source of liquidity for capital requirements not
met by cash fl ow from operations. An inability to access capital at competitive
rates or at all could adversely affect Duke Energy’s ability to implement its
strategy. Market disruptions or a downgrade of Duke Energy’s credit rating
may increase its cost of borrowing or adversely affect its ability to access one
or more sources of liquidity. For further information related to management’s
assessment of Duke Energy’s risk factors, see Item 1A, “Risk Factors.”
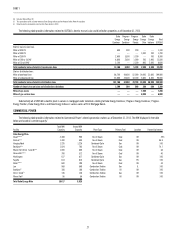
RESULTS OF OPERATIONS
In this section, Duke Energy provides analysis and discussion of earnings
and factors affecting earnings on both a GAAP and non-GAAP basis.
Management evaluates fi nancial performance in part based on the
non-GAAP fi nancial measure, Adjusted earnings and Adjusted diluted earnings
per share (EPS), which is measured as income from continuing operations
after deducting income attributable to noncontrolling interests, adjusted for the
dollar and per share impact of special items and the mark-to-market impacts
of economic hedges in the Commercial Power segment. Special items represent