Duke Energy 2012 Annual Report Download - page 18
Download and view the complete annual report
Please find page 18 of the 2012 Duke Energy annual report below. You can navigate through the pages in the report by either clicking on the pages listed below, or by using the keyword search tool below to find specific information within the annual report.-
 1
1 -
2
-
3
-
4
-
5
-
6
-
7
-
 8
8 -
 9
9 -
 10
10 -
 11
11 -
 12
12 -
 13
13 -
 14
14 -
 15
15 -
 16
16 -
 17
17 -
 18
18 -
 19
19 -
 20
20 -
 21
21 -
 22
22 -
 23
23 -
 24
24 -
 25
25 -
 26
26 -
 27
27 -
 28
28 -
29
-
30
-
31
-
32
-
33
-
34
-
35
-
36
-
37
-
38
-
39
-
40
-
41
-
42
-
43
-
44
-
45
-
46
-
47
-
48
-
49
-
50
-
51
-
52
-
53
-
54
-
55
-
56
-
57
-
58
-
59
-
60
-
61
-
62
-
63
-
64
-
65
-
66
-
67
-
68
-
69
-
70
-
71
-
72
-
73
-
74
-
75
-
76
-
77
-
78
-
79
-
80
-
81
-
82
-
83
-
84
-
85
-
86
-
87
-
88
-
89
-
90
-
91
-
92
-
93
-
94
-
95
-
96
-
97
-
98
-
99
-
100
-
101
-
102
-
103
-
104
-
105
-
106
-
107
-
108
-
109
-
110
-
111
-
112
-
113
-
114
-
115
-
116
-
117
-
118
-
119
-
120
-
121
-
122
-
123
-
124
-
125
-
126
-
127
-
128
-
129
-
130
-
131
-
132
-
133
-
134
-
135
-
136
-
137
-
138
-
139
-
140
-
141
-
142
-
143
-
144
-
145
-
146
-
147
-
148
-
149
-
150
-
151
-
152
-
153
-
154
-
155
-
156
-
157
-
158
-
159
-
160
-
161
-
162
-
163
-
164
-
165
-
166
-
167
-
168
-
169
-
170
-
171
-
172
-
173
-
174
-
175
-
176
-
177
-
178
-
179
-
180
-
181
-
182
-
183
-
184
-
185
-
186
-
187
-
188
-
189
-
190
-
191
-
192
-
193
-
194
-
195
-
196
-
197
-
198
-
199
-
200
-
201
-
202
-
203
-
204
-
205
-
206
-
207
-
208
-
209
-
210
-
211
-
212
-
213
-
214
-
215
-
216
-
217
-
218
-
219
-
220
-
221
-
222
-
223
-
224
-
225
-
226
-
227
-
228
-
229
-
230
-
231
-
232
-
233
-
234
-
235
-
236
-
237
-
238
-
239
-
240
-
241
-
242
-
243
-
244
-
245
-
246
-
247
-
248
-
249
-
250
-
251
-
252
-
253
-
254
-
255
-
256
-
257
-
258
-
259
-
260
-
261
-
262
-
263
-
264
-
265
-
266
-
267
-
268
-
269
-
270
-
271
-
272
-
273
-
274
-
275
-
276
-
277
-
278
-
279
-
280
-
281
-
282
-
283
-
284
-
285
-
286
-
287
-
288
-
289
-
290
-
291
-
292
-
293
-
294
-
295
-
296
-
297
-
298
-
299
-
300
-
301
-
302
-
303
-
304
-
305
-
306
-
307
-
308
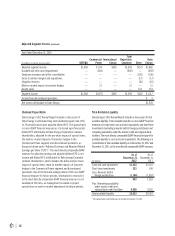
 |
 |

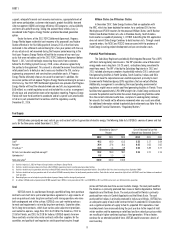
Year Ended December 31, 2010
Total
Commercial International Reportable Duke
(In millions, except per-share amounts) USFE&G Power Energy Segments Other Energy
Adjusted segment income $1,380 $ 254 $305 $1,939 $(57) $1,882
Goodwill and other asset impairments — (602) — (602) — (602)
Employee severance and office consolidation — — — — (105) (105)
Costs to achieve mergers and acquisitions — — — — (17) (17)
Litigation reserves — — — — (16) (16)
Mark-to-market impact of economic hedges — 21 — 21 — 21
Assets sales — — — — 154 154
Segment income $1,380 $(327) $305 $1,358 $(41) $ 1, 317
Income from discontinued operations $ 3
Net income attributable to Duke Energy $1,320
Adjusted Segment Income (continued)
Dividend Payout Ratio
Duke Energy’s 2012 Annual Report includes a discussion of
Duke Energy’s anticipated long-term dividend payout ratio of 65
to 70 percent based upon adjusted diluted EPS. This payout ratio
is a non-GAAP nancial measure as it is based upon forecasted
diluted EPS attributable to Duke Energy Corporation common
shareholders, adjusted for the per-share impact of special items,
the mark-to-market impacts of economic hedges in the
Commercial Power segment and discontinued operations, as
discussed above under “Adjusted Earnings and Adjusted Diluted
Earnings per Share (“EPS” ).” The most directly comparable GAAP
measure for adjusted earnings and adjusted diluted EPS is net
income and diluted EPS attributable to Duke Energy Corporate
common shareholders, which includes the dollar and per share
impact of special items, mark-to-market impacts of economic
hedges in the Commercial Power segment and discontinued
operations. Due to the forward-looking nature of this non-GAAP
nancial measure for future periods, information to reconcile it
to the most directly comparable GAAP nancial measure is not
available at this time, as management is unable to project
special items or mark-to-market adjustments for future periods.
Total Available Liquidity
Duke Energy’s 2012 Annual Report includes a discussion of total
available liquidity. Total available liquidity is a non-GAAP nancial
measure as it represents cash and cash equivalents and short-term
investments (excluding amounts held in foreign jurisdictions) and
remaining availability under the master credit and regional bank
facilities. The most directly comparable GAAP nancial measure for
available liquidity is cash and cash equivalents. The following is a
reconciliation of total available liquidity as of December 31, 2012 and
December 31, 2011, to the most directly comparable GAAP measure:
As of As of
December 31, December 31,
(In millions) 2012 2011
Cash and cash equivalents $1,424 $2,110
Short-term investments 333 190
Less: Amounts held in
foreign jurisdictions (1,104) (1,037)
653 1,263
Plus: Remaining availability
under master credit and
regional bank credit facilitiesa 4,900 3,255
Total available liquidity $5,553 $4,518
a
The regional bank credit facility was terminated at December 31, 2012.
16