Duke Energy 2012 Annual Report Download - page 57
Download and view the complete annual report
Please find page 57 of the 2012 Duke Energy annual report below. You can navigate through the pages in the report by either clicking on the pages listed below, or by using the keyword search tool below to find specific information within the annual report.-
 1
1 -
2
-
3
-
4
-
5
-
6
-
7
-
8
-
9
-
10
-
11
-
12
-
13
-
14
-
15
-
16
-
17
-
18
-
19
-
20
-
21
-
22
-
23
-
24
-
25
-
26
-
27
-
28
-
29
-
30
-
31
-
32
-
33
-
34
-
35
-
36
-
37
-
38
-
39
-
40
-
41
-
42
-
43
-
44
-
45
-
46
-
 47
47 -
 48
48 -
 49
49 -
 50
50 -
 51
51 -
 52
52 -
 53
53 -
 54
54 -
 55
55 -
 56
56 -
 57
57 -
 58
58 -
 59
59 -
 60
60 -
 61
61 -
 62
62 -
 63
63 -
 64
64 -
 65
65 -
 66
66 -
 67
67 -
68
-
69
-
70
-
71
-
72
-
73
-
74
-
75
-
76
-
77
-
78
-
79
-
80
-
81
-
82
-
83
-
84
-
85
-
86
-
87
-
88
-
89
-
90
-
91
-
92
-
93
-
94
-
95
-
96
-
97
-
98
-
99
-
100
-
101
-
102
-
103
-
104
-
105
-
106
-
107
-
108
-
109
-
110
-
111
-
112
-
113
-
114
-
115
-
116
-
117
-
118
-
119
-
120
-
121
-
122
-
123
-
124
-
125
-
126
-
127
-
128
-
129
-
130
-
131
-
132
-
133
-
134
-
135
-
136
-
137
-
138
-
139
-
140
-
141
-
142
-
143
-
144
-
145
-
146
-
147
-
148
-
149
-
150
-
151
-
152
-
153
-
154
-
155
-
156
-
157
-
158
-
159
-
160
-
161
-
162
-
163
-
164
-
165
-
166
-
167
-
168
-
169
-
170
-
171
-
172
-
173
-
174
-
175
-
176
-
177
-
178
-
179
-
180
-
181
-
182
-
183
-
184
-
185
-
186
-
187
-
188
-
189
-
190
-
191
-
192
-
193
-
194
-
195
-
196
-
197
-
198
-
199
-
200
-
201
-
202
-
203
-
204
-
205
-
206
-
207
-
208
-
209
-
210
-
211
-
212
-
213
-
214
-
215
-
216
-
217
-
218
-
219
-
220
-
221
-
222
-
223
-
224
-
225
-
226
-
227
-
228
-
229
-
230
-
231
-
232
-
233
-
234
-
235
-
236
-
237
-
238
-
239
-
240
-
241
-
242
-
243
-
244
-
245
-
246
-
247
-
248
-
249
-
250
-
251
-
252
-
253
-
254
-
255
-
256
-
257
-
258
-
259
-
260
-
261
-
262
-
263
-
264
-
265
-
266
-
267
-
268
-
269
-
270
-
271
-
272
-
273
-
274
-
275
-
276
-
277
-
278
-
279
-
280
-
281
-
282
-
283
-
284
-
285
-
286
-
287
-
288
-
289
-
290
-
291
-
292
-
293
-
294
-
295
-
296
-
297
-
298
-
299
-
300
-
301
-
302
-
303
-
304
-
305
-
306
-
307
-
308
 |
 |

37
PART II
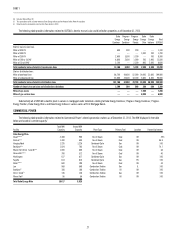
U.S. Franchised Electric and Gas
U.S. Franchised Electric and Gas includes the regulated operations of Duke Energy Carolinas, Progress Energy Carolinas, Progress Energy Florida, Duke Energy
Ohio and Duke Energy Indiana.
Years Ended December 31,
(in millions) 2012 2011
Variance
2012 vs.
2011 2010
Variance
2011 vs.
2010
Operating revenues $ 16,080 $ 10,619 $ 5,461 $ 10,597 $ 22
Operating expenses 12,943 8,473 4,470 8,144 329
Gains on sales of other assets and other, net 15 213 5 (3)
Operating income 3,152 2,148 1,004 2,458 (310)
Other income and expense, net 341 274 67 278 (4)
Interest expense 806 568 238 569 (1)
Income before income taxes 2,687 1,854 833 2,167 (313)
Income tax expense 941 673 268 787 (114)
Less: Income attributable to noncontrolling interest 2—2——
Segment income $ 1,744 $ 1,181 $ 563 $ 1,380 $ (199)
Duke Energy Carolinas’ GWh sales(a)(b) 81,362 82,127 (765) 85,441 (3,314)
Progress Energy Carolinas’ GWh sales(a)(c)(d) 58,390 56,223 2,167 59,702 (3,479)
Progress Energy Florida GWh sales(a)(e) 38,443 39,578 (1,135) 43,240 (3,662)
Duke Energy Ohio GWh sales(a) 24,344 24,923 (579) 25,519 (596)
Duke Energy Indiana GWh sales(a) 33,577 33,181 396 34,899 (1,718)
Total USFE&G GWh sales 236,116 236,032 84 248,801 (12,769)
Net proportional MW capacity in operation(f) 49,654 27,397 26,869
(a) Gigawatt-hours (GWh).
(b) Includes 421 GWh sales associated with interim fi rm power sale agreements (Interim FERC Mitigation) entered into as part of FERC’s approval of the merger with Progress Energy, which are not included in the operating
results in the table above, for the year ended December 31, 2012. See Note 2 to the Consolidated Financial Statements, “Acquisitions, Dispositions and Sales of Other Assets,” for a discussion of the Interim FERC Mitigation.
(c) Includes 577 GWh sales associated with the Interim FERC Mitigation, which are not included in the operating results in the table above, for year ended December 31, 2012. See Note 2 to the Consolidated Financial
Statements, “Acquisitions, Dispositions and Sales of Other Assets,” for a discussion of the Interim FERC Mitigation.
(d) All of Progress Energy Carolinas’ GWh sales for the years ended December 31, 2011 and December 31, 2010, and 26,634 GWh sales for the year ended December 31, 2012, occurred prior to the merger between Duke Energy
and Progress Energy.
(e) All of Progress Energy Florida’s GWh sales for the years ended December 31, 2011 and December 31, 2010, and 18,348 GWh sales for the year ended December 31, 2012, occurred prior to the merger between Duke Energy
and Progress Energy.
(f) Megawatt (MW).
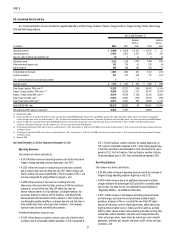
Year Ended December 31, 2012 as Compared to December 31, 2011
Operating Revenues.
The variance was driven primarily by:
• A $4,918 million increase in operating revenues due to the inclusion of
Progress Energy operating revenues beginning in July 2012,
• A $352 million net increase in retail pricing and rate riders primarily
due to revised retail rates resulting from the 2011 North Carolina and
South Carolina rate cases implemented in the fi rst quarter of 2012, and
revenues recognized for energy effi ciency programs, and
• A $293 million increase in fuel revenues (including emission
allowances) driven primarily by higher revenues in Ohio for purchases
of power as a result of the new Ohio ESP, higher fuel rates for
electric retail customers in all jurisdictions, and higher revenues for
purchases of power in Indiana and the Carolinas, partially offset by
decreased demand from electric retail customers in 2012 mainly due
to unfavorable weather conditions, and lower demand and fuel rates in
Ohio and Kentucky from natural gas retail customers . Fuel revenues
represent sales to retail and wholesale customers.
Partially offsetting these increases was:
• A $155 million decrease in electric and gas sales (net of fuel) to retail
customers due to unfavorable weather conditions in 2012 compared to
2011. For the Carolinas, weather statistics for cooling degree days in
2012 were less favorable compared to 2011, while cooling degree days
in the Ohio and Indiana were favorable in 2012 compared to the same
period in 2011. For the Carolinas, Ohio and Indiana, weather statistics
for heating degree days in 2012 were unfavorable compared to 2011.
Operating Expenses.
The increase was driven primarily by:
• A $3,845 million increase in operating expenses due to the inclusion of
Progress Energy operating expenses beginning in July 2012,
• A $378 million increase due to an additional impairment and other
charges related to the Edwardsport IGCC plant that is currently under
construction. See Note 4 to the Consolidated Financial Statements,
“Regulatory Matters,” for additional information,
• A $277 million increase in fuel expense (including purchased power
and natural gas purchases for resale) primarily related to higher
purchases of power in Ohio as a result of the new Ohio ESP, higher
volumes of natural gas used in electric generation, higher coal prices,
higher purchased power costs in Indiana and the Carolinas, partially
offset by lower volume of coal used in electric generation resulting from
unfavorable weather conditions and lower coal-fi red generation due
to low natural gas prices, lower prices for natural gas used in electric
generation, and lower gas volumes and prices to full-service retail gas
customers, and