Duke Energy 2012 Annual Report Download - page 189
Download and view the complete annual report
Please find page 189 of the 2012 Duke Energy annual report below. You can navigate through the pages in the report by either clicking on the pages listed below, or by using the keyword search tool below to find specific information within the annual report.-
 1
1 -
2
-
3
-
4
-
5
-
6
-
7
-
8
-
9
-
10
-
11
-
12
-
13
-
14
-
15
-
16
-
17
-
18
-
19
-
20
-
21
-
22
-
23
-
24
-
25
-
26
-
27
-
28
-
29
-
30
-
31
-
32
-
33
-
34
-
35
-
36
-
37
-
38
-
39
-
40
-
41
-
42
-
43
-
44
-
45
-
46
-
47
-
48
-
49
-
50
-
51
-
52
-
53
-
54
-
55
-
56
-
57
-
58
-
59
-
60
-
61
-
62
-
63
-
64
-
65
-
66
-
67
-
68
-
69
-
70
-
71
-
72
-
73
-
74
-
75
-
76
-
77
-
78
-
79
-
80
-
81
-
82
-
83
-
84
-
85
-
86
-
87
-
88
-
89
-
90
-
91
-
92
-
93
-
94
-
95
-
96
-
97
-
98
-
99
-
100
-
101
-
102
-
103
-
104
-
105
-
106
-
107
-
108
-
109
-
110
-
111
-
112
-
113
-
114
-
115
-
116
-
117
-
118
-
119
-
120
-
121
-
122
-
123
-
124
-
125
-
126
-
127
-
128
-
129
-
130
-
131
-
132
-
133
-
134
-
135
-
136
-
137
-
138
-
139
-
140
-
141
-
142
-
143
-
144
-
145
-
146
-
147
-
148
-
149
-
150
-
151
-
152
-
153
-
154
-
155
-
156
-
157
-
158
-
159
-
160
-
161
-
162
-
163
-
164
-
165
-
166
-
167
-
168
-
169
-
170
-
171
-
172
-
173
-
174
-
175
-
176
-
177
-
178
-
 179
179 -
 180
180 -
 181
181 -
 182
182 -
 183
183 -
 184
184 -
 185
185 -
 186
186 -
 187
187 -
 188
188 -
 189
189 -
 190
190 -
 191
191 -
 192
192 -
 193
193 -
 194
194 -
 195
195 -
 196
196 -
 197
197 -
 198
198 -
 199
199 -
200
-
201
-
202
-
203
-
204
-
205
-
206
-
207
-
208
-
209
-
210
-
211
-
212
-
213
-
214
-
215
-
216
-
217
-
218
-
219
-
220
-
221
-
222
-
223
-
224
-
225
-
226
-
227
-
228
-
229
-
230
-
231
-
232
-
233
-
234
-
235
-
236
-
237
-
238
-
239
-
240
-
241
-
242
-
243
-
244
-
245
-
246
-
247
-
248
-
249
-
250
-
251
-
252
-
253
-
254
-
255
-
256
-
257
-
258
-
259
-
260
-
261
-
262
-
263
-
264
-
265
-
266
-
267
-
268
-
269
-
270
-
271
-
272
-
273
-
274
-
275
-
276
-
277
-
278
-
279
-
280
-
281
-
282
-
283
-
284
-
285
-
286
-
287
-
288
-
289
-
290
-
291
-
292
-
293
-
294
-
295
-
296
-
297
-
298
-
299
-
300
-
301
-
302
-
303
-
304
-
305
-
306
-
307
-
308
 |
 |

169
PART II
DUKE ENERGY CORPORATION • DUKE ENERGY CAROLINAS, LLC • PROGRESS ENERGY, INC. • CAROLINA POWER & LIGHT COMPANY d/b/a PROGRESS ENERGY
CAROLINAS, INC. • FLORIDA POWER CORPORATION d/b/a PROGRESS ENERY FLORIDA, INC. • DUKE ENERGY OHIO, INC. • DUKE ENERGY INDIANA, INC
.
Combined Notes to Consolidated Financial Statements – (Continued)
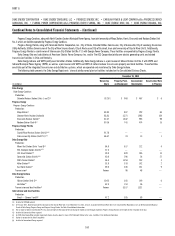
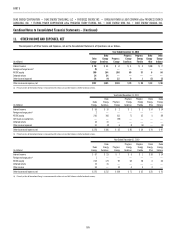
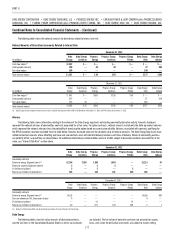
The following table presents Duke Energy’s investment in equity method unconsolidated affi liates by segment and geographic area.
December 31, 2012 December 31, 2011
(in millions) U.S. Foreign Total U.S. Foreign Total
U.S. Franchised Electric and Gas $ 5 $— $ 5 $5 $— $ 5
Commercial Power 219 — 219 188 — 188
International Energy — 81 81 — 91 91
Other 168 10 178 167 9 176
Investments in Equity Method Unconsolidated Affi liates $ 392 $ 91 $ 483
$360 $100 $460
The following table presents Duke Energy’s equity in earnings of equity method unconsolidated affi liates by segment.
Years Ended December 31,
2012 2011 2010
(in millions) U.S Foreign Total U.S Foreign Total U.S Foreign Total
U.S. Franchised Electric and Gas $ (5) $ — $ (5) $— $ — $ — $— $ — $ —
Commercial Power 14 — 14 6 — 6 7 — 7
International Energy — 134 134 — 145 145 — 102 102
Other 3 2 5 7 2 9 5 2 7
Equity in Earnings of Unconsolidated Affi liates $ 12 $136 $148 $ 13 $147 $160 $ 12 $104 $116
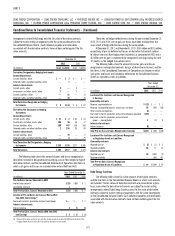
During the years ended December 31, 2012, 2011 and 2010, Duke Energy
received distributions from equity investments of $183 million, $149 million and
$111 million, respectively, which are included in Other assets within Cash Flows
from Operating Activities on the Consolidated Statements of Cash Flows.
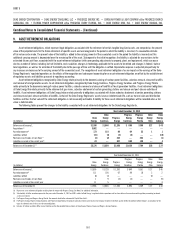
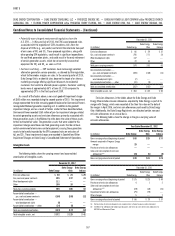
The following table presents Duke Energy’s summarized combined
fi nancial information of equity method unconsolidated affi liates.
December 31,
(in millions) 2012 2011
Balance Sheet
Current assets $ 577 $ 492
Non-current assets 2,252 1,599
Current liabilities (601) (267)
Non-current liabilities (579) (225)
Net assets $1,649 $1,599
Years Ended December 31,
(in millions) 2012 2011 2010
Income Statement
Operating revenues $1,624 $1,615 $1,385
Operating expenses $ 727 $ 865 $ 924
Net income $ 665 $ 607 $ 430
Other Investments
Commercial Power had an interest in South Houston Green Power, L.P.
(SHGP), which is a cogeneration facility containing three combustion turbines
in Texas City, Texas. Although Duke Energy owned a signifi cant portion of SHGP,
it was not consolidated as Duke Energy did not hold a majority voting control or
have the ability to exercise control over SHGP, nor was Duke Energy the primary
benefi ciary. Duke Energy exercised the cash settlement option of an asset
swap agreement for SHGP and received total cash proceeds of $184 million in
December 2010. This transaction did not result in a signifi cant gain.
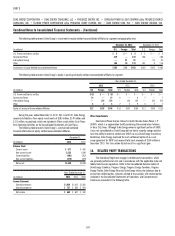
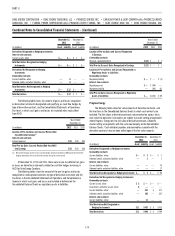
14. RELATED PARTY TRANSACTIONS
The Subsidiary Registrants engage in related party transactions, which
are generally performed at cost and in accordance with the applicable state and
federal commission regulations. Refer to the Consolidated Balance Sheets of
Duke Energy Carolinas, Progress Energy, Progress Energy Carolinas, Progress
Energy Florida, Duke Energy Ohio and Duke Energy Indiana for balances due to
or due from related parties. Amounts related to transactions with related parties
included in the Consolidated Statements of Operations and Comprehensive
Income are presented in the following table.