Duke Energy 2012 Annual Report Download - page 243
Download and view the complete annual report
Please find page 243 of the 2012 Duke Energy annual report below. You can navigate through the pages in the report by either clicking on the pages listed below, or by using the keyword search tool below to find specific information within the annual report.-
 1
1 -
2
-
3
-
4
-
5
-
6
-
7
-
8
-
9
-
10
-
11
-
12
-
13
-
14
-
15
-
16
-
17
-
18
-
19
-
20
-
21
-
22
-
23
-
24
-
25
-
26
-
27
-
28
-
29
-
30
-
31
-
32
-
33
-
34
-
35
-
36
-
37
-
38
-
39
-
40
-
41
-
42
-
43
-
44
-
45
-
46
-
47
-
48
-
49
-
50
-
51
-
52
-
53
-
54
-
55
-
56
-
57
-
58
-
59
-
60
-
61
-
62
-
63
-
64
-
65
-
66
-
67
-
68
-
69
-
70
-
71
-
72
-
73
-
74
-
75
-
76
-
77
-
78
-
79
-
80
-
81
-
82
-
83
-
84
-
85
-
86
-
87
-
88
-
89
-
90
-
91
-
92
-
93
-
94
-
95
-
96
-
97
-
98
-
99
-
100
-
101
-
102
-
103
-
104
-
105
-
106
-
107
-
108
-
109
-
110
-
111
-
112
-
113
-
114
-
115
-
116
-
117
-
118
-
119
-
120
-
121
-
122
-
123
-
124
-
125
-
126
-
127
-
128
-
129
-
130
-
131
-
132
-
133
-
134
-
135
-
136
-
137
-
138
-
139
-
140
-
141
-
142
-
143
-
144
-
145
-
146
-
147
-
148
-
149
-
150
-
151
-
152
-
153
-
154
-
155
-
156
-
157
-
158
-
159
-
160
-
161
-
162
-
163
-
164
-
165
-
166
-
167
-
168
-
169
-
170
-
171
-
172
-
173
-
174
-
175
-
176
-
177
-
178
-
179
-
180
-
181
-
182
-
183
-
184
-
185
-
186
-
187
-
188
-
189
-
190
-
191
-
192
-
193
-
194
-
195
-
196
-
197
-
198
-
199
-
200
-
201
-
202
-
203
-
204
-
205
-
206
-
207
-
208
-
209
-
210
-
211
-
212
-
213
-
214
-
215
-
216
-
217
-
218
-
219
-
220
-
221
-
222
-
223
-
224
-
225
-
226
-
227
-
228
-
229
-
230
-
231
-
232
-
 233
233 -
 234
234 -
 235
235 -
 236
236 -
 237
237 -
 238
238 -
 239
239 -
 240
240 -
 241
241 -
 242
242 -
 243
243 -
 244
244 -
 245
245 -
 246
246 -
 247
247 -
 248
248 -
 249
249 -
 250
250 -
 251
251 -
 252
252 -
 253
253 -
254
-
255
-
256
-
257
-
258
-
259
-
260
-
261
-
262
-
263
-
264
-
265
-
266
-
267
-
268
-
269
-
270
-
271
-
272
-
273
-
274
-
275
-
276
-
277
-
278
-
279
-
280
-
281
-
282
-
283
-
284
-
285
-
286
-
287
-
288
-
289
-
290
-
291
-
292
-
293
-
294
-
295
-
296
-
297
-
298
-
299
-
300
-
301
-
302
-
303
-
304
-
305
-
306
-
307
-
308
 |
 |

223
PART II
DUKE ENERGY CORPORATION • DUKE ENERGY CAROLINAS, LLC • PROGRESS ENERGY, INC. • CAROLINA POWER & LIGHT COMPANY d/b/a PROGRESS
ENERGY CAROLINAS, INC. • FLORIDA POWER CORPORATION d/b/a PROGRESS ENERY FLORIDA, INC. • DUKE ENERGY OHIO, INC. • DUKE ENERGY INDIANA, INC.
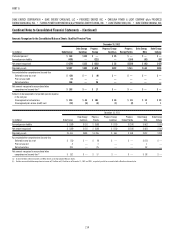
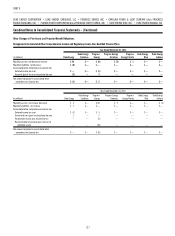
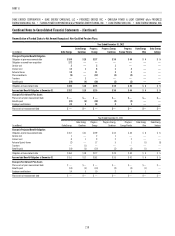
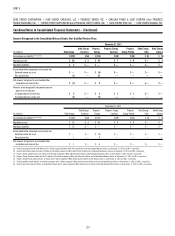
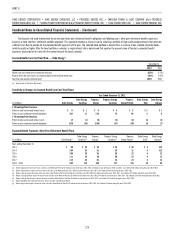
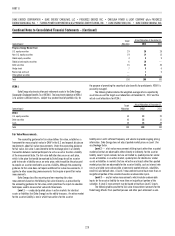
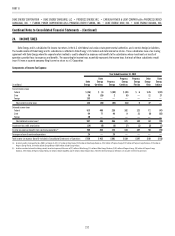
Combined Notes to Consolidated Financial Statements – (Continued)
Year Ended December 31, 2011
(in millions) Duke Energy
Duke Energy
Carolinas
Progress
Energy
Progress Energy
Carolinas
Progress
Energy Florida
Duke Energy
Ohio
Duke Energy
Indiana
Regulatory assets, net (decrease) increase $(22) $(12) $ 74 $ 43 $ 28 $— $ (7)
Regulatory liabilities, net increase (decrease) $ 21 $ — $ — $ — $ — $ (1) $ 12
Accumulated other comprehensive (income) loss
Deferred income tax liability $ 1 $ — $ (2) $ — $ — $ (1) $—
Actuarial losses (gains) arising during the year — — 2 — — 2 —
Amortization of prior year actuarial losses 1 — — — — 1 —
Reclassifi cation of actuarial losses to regulatory assets — — 4 — — — —
Net amount recognized in accumulated other
comprehensive (income) loss $ 2 $ — $ 4 $ — $ — $ 2 $—
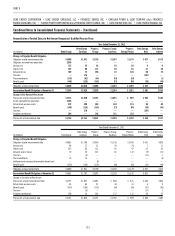
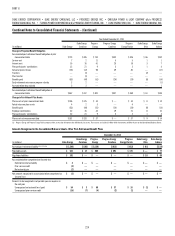
Reconciliation of Funded Status to Accrued Other Post-Retirement Benefi t Costs
Year Ended December 31, 2012
(in millions) Duke Energy
Duke Energy
Carolinas
Progress
Energy
Progress Energy
Carolinas
Progress
Energy Florida
Duke Energy
Ohio
Duke Energy
Indiana
Change in Projected Benefi t Obligation
Accumulated post-retirement benefi t obligation at prior
measurement date $ 667 $312 $ 841 $407 $368 $ 61 $135
Obligation assumed from acquisition 977 — — — — — —
Service cost 16 2 17 8 7 1 1
Interest cost 56 15 43 23 18 3 6
Plan participants’ contributions 41 18 13 5 7 4 8
Actuarial gains 198 28 291 205 49 3 (2)
Transfers — 9 — — — (16) —
Benefi ts paid (105) (38) (61) (24) (33) (8) (13)
Special termination benefi t cost 915 2 1——
Plan amendments (70) (33) (25) (16) (6) — —
Accrued retiree drug subsidy 524 2 2—1
Accumulated post-retirement benefi t obligation at
measurement date $1,794 $316 $1,128 $612 $413 $ 48 $136
Change in Fair Value of Plan Assets
Plan assets at prior measurement date $ 181 $120 $ 37 $ — $ 37 $ 9 $ 14
Actual return on plan assets 23 12 2 — 2 1 2
Benefi ts paid (105) (38) (61) (24) (33) (8) (13)
Transfers(a) — 5 (39) — (39) (3) —
Employer contributions 58 17 48 19 26 4 6
Plan participants’ contributions 41 18 13 5 7 4 8
Plan assets at measurement date $ 198 $134 $ — $ — $ — $ 7 $ 17