Duke Energy 2012 Annual Report Download - page 13
Download and view the complete annual report
Please find page 13 of the 2012 Duke Energy annual report below. You can navigate through the pages in the report by either clicking on the pages listed below, or by using the keyword search tool below to find specific information within the annual report.-
 1
1 -
2
-
 3
3 -
 4
4 -
 5
5 -
 6
6 -
 7
7 -
 8
8 -
 9
9 -
 10
10 -
 11
11 -
 12
12 -
 13
13 -
 14
14 -
 15
15 -
 16
16 -
 17
17 -
 18
18 -
 19
19 -
 20
20 -
 21
21 -
 22
22 -
 23
23 -
24
-
25
-
26
-
27
-
28
-
29
-
30
-
31
-
32
-
33
-
34
-
35
-
36
-
37
-
38
-
39
-
40
-
41
-
42
-
43
-
44
-
45
-
46
-
47
-
48
-
49
-
50
-
51
-
52
-
53
-
54
-
55
-
56
-
57
-
58
-
59
-
60
-
61
-
62
-
63
-
64
-
65
-
66
-
67
-
68
-
69
-
70
-
71
-
72
-
73
-
74
-
75
-
76
-
77
-
78
-
79
-
80
-
81
-
82
-
83
-
84
-
85
-
86
-
87
-
88
-
89
-
90
-
91
-
92
-
93
-
94
-
95
-
96
-
97
-
98
-
99
-
100
-
101
-
102
-
103
-
104
-
105
-
106
-
107
-
108
-
109
-
110
-
111
-
112
-
113
-
114
-
115
-
116
-
117
-
118
-
119
-
120
-
121
-
122
-
123
-
124
-
125
-
126
-
127
-
128
-
129
-
130
-
131
-
132
-
133
-
134
-
135
-
136
-
137
-
138
-
139
-
140
-
141
-
142
-
143
-
144
-
145
-
146
-
147
-
148
-
149
-
150
-
151
-
152
-
153
-
154
-
155
-
156
-
157
-
158
-
159
-
160
-
161
-
162
-
163
-
164
-
165
-
166
-
167
-
168
-
169
-
170
-
171
-
172
-
173
-
174
-
175
-
176
-
177
-
178
-
179
-
180
-
181
-
182
-
183
-
184
-
185
-
186
-
187
-
188
-
189
-
190
-
191
-
192
-
193
-
194
-
195
-
196
-
197
-
198
-
199
-
200
-
201
-
202
-
203
-
204
-
205
-
206
-
207
-
208
-
209
-
210
-
211
-
212
-
213
-
214
-
215
-
216
-
217
-
218
-
219
-
220
-
221
-
222
-
223
-
224
-
225
-
226
-
227
-
228
-
229
-
230
-
231
-
232
-
233
-
234
-
235
-
236
-
237
-
238
-
239
-
240
-
241
-
242
-
243
-
244
-
245
-
246
-
247
-
248
-
249
-
250
-
251
-
252
-
253
-
254
-
255
-
256
-
257
-
258
-
259
-
260
-
261
-
262
-
263
-
264
-
265
-
266
-
267
-
268
-
269
-
270
-
271
-
272
-
273
-
274
-
275
-
276
-
277
-
278
-
279
-
280
-
281
-
282
-
283
-
284
-
285
-
286
-
287
-
288
-
289
-
290
-
291
-
292
-
293
-
294
-
295
-
296
-
297
-
298
-
299
-
300
-
301
-
302
-
303
-
304
-
305
-
306
-
307
-
308
 |
 |

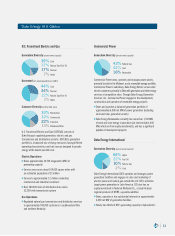
U.S. Franchised Electric and Gas
Generation Diversity (percent owned capacity) Generation Diversity (percent owned capacity)
Generated (net output gigawatt-hours (GWh))
Customer Diversity (in billed GWh sales)
Commercial Power
U.S. Franchised Electric and Gas (USFE&G) consists of
Duke Energy’s regulated generation, electric and gas
transmission and distribution systems. USFE&G’s generation
portfolio is a balanced mix of energy resources having different
operating characteristics and fuel sources designed to provide
energy at the lowest possible cost.
Electric Operations
Owns approximately 49,700 megawatts (MW) of
generating capacity
Service area covers about 104,000 square miles with
an estimated population of 22 million
Service to approximately 7.2 million residential,
commercial and industrial customers
Over 289,900 miles of distribution lines and a
32,200-mile transmission system
Gas Operations
Regulated natural gas transmission and distribution services
to approximately 500,000 customers in southwestern Ohio
and northern Kentucky
Commercial Power owns, operates and manages power plants,
primarily located in the Midwest, and a renewable energy portfolio.
Commercial Power’s subsidiary, Duke Energy Retail, serves retail
electric customers primarily in Ohio with generation and other energy
services at competitive rates. Through Duke Energy Generation
Services, Inc., Commercial Power engages in the development,
construction and operation of renewable energy projects.
Owns and operates a balanced generation portfolio of
approximately 6,800 net MW of power generation (excluding
wind and solar generation assets)
Duke Energy Renewables currently has more than 1,700 MW
of wind and solar energy in operation (pie chart excludes 440
MW, which are from equity investments), and has a signicant
pipeline of development projects
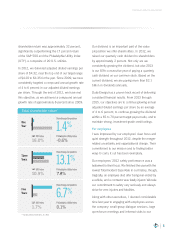
39%
Coal
37%
Natural
Gas/Fuel
Oil
17%
Nuclear
7%
Hydro
44%
Coal
34%
Nuclear
21%
Natural
Gas/Fuel
Oil
1%
Hydro
42%
Natural
Gas
42%
Coal
16%
Renewable
33%
Residential
32%
Commercial
22%
Industrial
13%
Wholesale/Other
Generation Diversity (percent owned capacity)
Duke Energy International
Duke Energy International (DEI) operates and manages power
generation facilities and engages in sales and marketing of
electric power and natural gas outside the U.S. DEI’s activities
target power generation in Latin America. DEI also has an
equity investment in National Methanol Co., a Saudi Arabian
regional producer of MTBE, a gasoline additive.
Owns, operates or has substantial interests in approximately
4,600 net MW of generation facilities
Nearly two-thirds of DEI’s generating capacity is hydroelectric
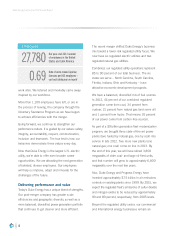
66%
Hydro
22%
Fuel
Oil
10 %
Natural
Gas
2%
Coal
Duke Energy At A Glance
11