Duke Energy 2012 Annual Report Download - page 202
Download and view the complete annual report
Please find page 202 of the 2012 Duke Energy annual report below. You can navigate through the pages in the report by either clicking on the pages listed below, or by using the keyword search tool below to find specific information within the annual report.-
 1
1 -
2
-
3
-
4
-
5
-
6
-
7
-
8
-
9
-
10
-
11
-
12
-
13
-
14
-
15
-
16
-
17
-
18
-
19
-
20
-
21
-
22
-
23
-
24
-
25
-
26
-
27
-
28
-
29
-
30
-
31
-
32
-
33
-
34
-
35
-
36
-
37
-
38
-
39
-
40
-
41
-
42
-
43
-
44
-
45
-
46
-
47
-
48
-
49
-
50
-
51
-
52
-
53
-
54
-
55
-
56
-
57
-
58
-
59
-
60
-
61
-
62
-
63
-
64
-
65
-
66
-
67
-
68
-
69
-
70
-
71
-
72
-
73
-
74
-
75
-
76
-
77
-
78
-
79
-
80
-
81
-
82
-
83
-
84
-
85
-
86
-
87
-
88
-
89
-
90
-
91
-
92
-
93
-
94
-
95
-
96
-
97
-
98
-
99
-
100
-
101
-
102
-
103
-
104
-
105
-
106
-
107
-
108
-
109
-
110
-
111
-
112
-
113
-
114
-
115
-
116
-
117
-
118
-
119
-
120
-
121
-
122
-
123
-
124
-
125
-
126
-
127
-
128
-
129
-
130
-
131
-
132
-
133
-
134
-
135
-
136
-
137
-
138
-
139
-
140
-
141
-
142
-
143
-
144
-
145
-
146
-
147
-
148
-
149
-
150
-
151
-
152
-
153
-
154
-
155
-
156
-
157
-
158
-
159
-
160
-
161
-
162
-
163
-
164
-
165
-
166
-
167
-
168
-
169
-
170
-
171
-
172
-
173
-
174
-
175
-
176
-
177
-
178
-
179
-
180
-
181
-
182
-
183
-
184
-
185
-
186
-
187
-
188
-
189
-
190
-
191
-
 192
192 -
 193
193 -
 194
194 -
 195
195 -
 196
196 -
 197
197 -
 198
198 -
 199
199 -
 200
200 -
 201
201 -
 202
202 -
 203
203 -
 204
204 -
 205
205 -
 206
206 -
 207
207 -
 208
208 -
 209
209 -
 210
210 -
 211
211 -
 212
212 -
213
-
214
-
215
-
216
-
217
-
218
-
219
-
220
-
221
-
222
-
223
-
224
-
225
-
226
-
227
-
228
-
229
-
230
-
231
-
232
-
233
-
234
-
235
-
236
-
237
-
238
-
239
-
240
-
241
-
242
-
243
-
244
-
245
-
246
-
247
-
248
-
249
-
250
-
251
-
252
-
253
-
254
-
255
-
256
-
257
-
258
-
259
-
260
-
261
-
262
-
263
-
264
-
265
-
266
-
267
-
268
-
269
-
270
-
271
-
272
-
273
-
274
-
275
-
276
-
277
-
278
-
279
-
280
-
281
-
282
-
283
-
284
-
285
-
286
-
287
-
288
-
289
-
290
-
291
-
292
-
293
-
294
-
295
-
296
-
297
-
298
-
299
-
300
-
301
-
302
-
303
-
304
-
305
-
306
-
307
-
308
 |
 |

182
PART II
DUKE ENERGY CORPORATION • DUKE ENERGY CAROLINAS, LLC • PROGRESS ENERGY, INC. • CAROLINA POWER & LIGHT COMPANY d/b/a PROGRESS ENERGY
CAROLINAS, INC. • FLORIDA POWER CORPORATION d/b/a PROGRESS ENERY FLORIDA, INC. • DUKE ENERGY OHIO, INC. • DUKE ENERGY INDIANA, INC.
Combined Notes to Consolidated Financial Statements – (Continued)
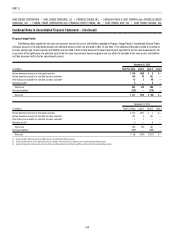
Goodwill and Long-lived Assets.
See Note 12 for a discussion of the valuation for goodwill and long-lived assets.
Duke Energy
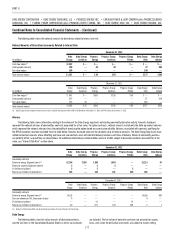
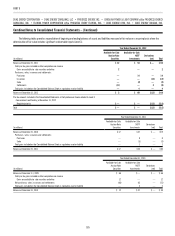
The following tables provide the fair value measurement amounts for assets and liabilities recorded on Duke Energy’s Consolidated Balance Sheets. Financial assets
and liabilities are classifi ed in their entirety based on the lowest level of input signifi cant to the fair value measurement. Our assessment of the signifi cance of a particular
input to the fair value measurement requires judgment and may affect the valuation of fair value assets and liabilities and their placement within the fair value hierarchy
levels. Derivative amounts in the table below exclude cash collateral amounts which are disclosed in Note 15. See Note 17 for additional information related to investments
by major security type.
December 31, 2012
(in millions) Total Fair Value Level 1 Level 2 Level 3
Investments in available-for-sale auction rate securities(a) $ 29 $ — $ — $ 29
Nuclear decommissioning trust fund equity securities 2,837 2,762 54 21
Nuclear decommissioning trust fund debt securities 1,405 317 1,040 48
Other trading and available-for-sale equity securities(b) 72 63 9 —
Other trading and available-for-sale debt securities(c) 602 40 562 —
Derivative assets(b) 103 18 22 63
Total assets 5,048 3,200 1,687 161
Derivative liabilities(d) (756) (17) (591) (148)
Net assets $ 4,292 $3,183 $1,096 $ 13
December 31, 2011
(in millions) Total Fair Value Level 1 Level 2 Level 3
Investments in available-for-sale auction rate securities(a) $ 71 $ — $ — $ 71
Nuclear decommissioning trust fund equity securities 1,337 1,285 46 6
Nuclear decommissioning trust fund debt securities 723 109 567 47
Other trading and available-for-sale equity securities(b) 68 61 7 —
Other trading and available-for-sale debt securities(c) 382 22 360 —
Derivative assets(b) 74 43 6 25
Total Assets 2,655 1,520 986 149
Derivative liabilities(d) (264) (36) (164) (64)
Net Assets $2,391 $1,484 $ 822 $ 85
(a) Included in Other within Investments and Other Assets on the Consolidated Balance Sheets.
(b) Included in Other within Current Assets and Other within Investments and Other Assets on the Consolidated Balance Sheet.
(c) Included in Other within Investments and Other Assets and Short-term Investments on the Consolidated Balance Sheets.
(d) Included in Other within Current Liabilities and Other within Deferred Credits and Other Liabilities on the Consolidated Balance Sheets.