Duke Energy 2012 Annual Report Download - page 236
Download and view the complete annual report
Please find page 236 of the 2012 Duke Energy annual report below. You can navigate through the pages in the report by either clicking on the pages listed below, or by using the keyword search tool below to find specific information within the annual report.-
 1
1 -
2
-
3
-
4
-
5
-
6
-
7
-
8
-
9
-
10
-
11
-
12
-
13
-
14
-
15
-
16
-
17
-
18
-
19
-
20
-
21
-
22
-
23
-
24
-
25
-
26
-
27
-
28
-
29
-
30
-
31
-
32
-
33
-
34
-
35
-
36
-
37
-
38
-
39
-
40
-
41
-
42
-
43
-
44
-
45
-
46
-
47
-
48
-
49
-
50
-
51
-
52
-
53
-
54
-
55
-
56
-
57
-
58
-
59
-
60
-
61
-
62
-
63
-
64
-
65
-
66
-
67
-
68
-
69
-
70
-
71
-
72
-
73
-
74
-
75
-
76
-
77
-
78
-
79
-
80
-
81
-
82
-
83
-
84
-
85
-
86
-
87
-
88
-
89
-
90
-
91
-
92
-
93
-
94
-
95
-
96
-
97
-
98
-
99
-
100
-
101
-
102
-
103
-
104
-
105
-
106
-
107
-
108
-
109
-
110
-
111
-
112
-
113
-
114
-
115
-
116
-
117
-
118
-
119
-
120
-
121
-
122
-
123
-
124
-
125
-
126
-
127
-
128
-
129
-
130
-
131
-
132
-
133
-
134
-
135
-
136
-
137
-
138
-
139
-
140
-
141
-
142
-
143
-
144
-
145
-
146
-
147
-
148
-
149
-
150
-
151
-
152
-
153
-
154
-
155
-
156
-
157
-
158
-
159
-
160
-
161
-
162
-
163
-
164
-
165
-
166
-
167
-
168
-
169
-
170
-
171
-
172
-
173
-
174
-
175
-
176
-
177
-
178
-
179
-
180
-
181
-
182
-
183
-
184
-
185
-
186
-
187
-
188
-
189
-
190
-
191
-
192
-
193
-
194
-
195
-
196
-
197
-
198
-
199
-
200
-
201
-
202
-
203
-
204
-
205
-
206
-
207
-
208
-
209
-
210
-
211
-
212
-
213
-
214
-
215
-
216
-
217
-
218
-
219
-
220
-
221
-
222
-
223
-
224
-
225
-
 226
226 -
 227
227 -
 228
228 -
 229
229 -
 230
230 -
 231
231 -
 232
232 -
 233
233 -
 234
234 -
 235
235 -
 236
236 -
 237
237 -
 238
238 -
 239
239 -
 240
240 -
 241
241 -
 242
242 -
 243
243 -
 244
244 -
 245
245 -
 246
246 -
247
-
248
-
249
-
250
-
251
-
252
-
253
-
254
-
255
-
256
-
257
-
258
-
259
-
260
-
261
-
262
-
263
-
264
-
265
-
266
-
267
-
268
-
269
-
270
-
271
-
272
-
273
-
274
-
275
-
276
-
277
-
278
-
279
-
280
-
281
-
282
-
283
-
284
-
285
-
286
-
287
-
288
-
289
-
290
-
291
-
292
-
293
-
294
-
295
-
296
-
297
-
298
-
299
-
300
-
301
-
302
-
303
-
304
-
305
-
306
-
307
-
308
 |
 |

216
PART II
DUKE ENERGY CORPORATION • DUKE ENERGY CAROLINAS, LLC • PROGRESS ENERGY, INC. • CAROLINA POWER & LIGHT COMPANY d/b/a PROGRESS
ENERGY CAROLINAS, INC. • FLORIDA POWER CORPORATION d/b/a PROGRESS ENERY FLORIDA, INC. • DUKE ENERGY OHIO, INC. • DUKE ENERGY INDIANA, INC.
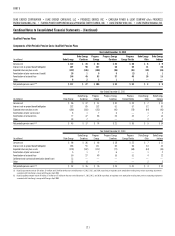
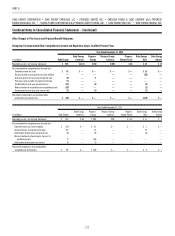
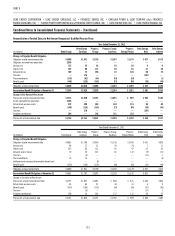
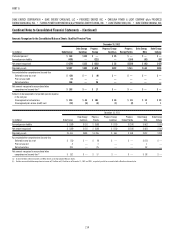
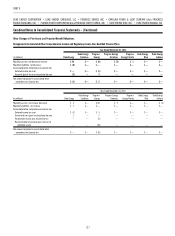
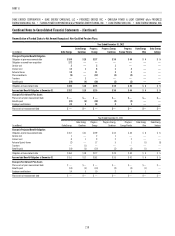
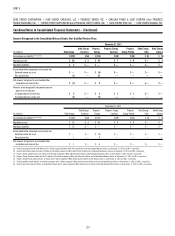
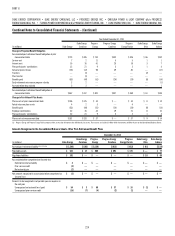
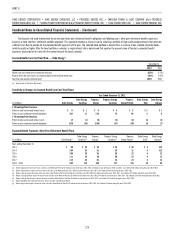
Combined Notes to Consolidated Financial Statements – (Continued)
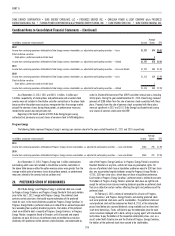
The discount rate used to determine the current year pension obligation and following year’s pension expense is based on a bond selection-settlement portfolio
approach. This approach develops a discount rate by selecting a portfolio of high quality corporate bonds that generate suffi cient cash fl ow to provide for the projected
benefi t payments of the plan. The selected bond portfolio is derived from a universe of non-callable corporate bonds rated Aa quality or higher. After the bond portfolio
is selected, a single interest rate is determined that equates the present value of the plan’s projected benefi t payments discounted at this rate with the market value
of the bonds selected.
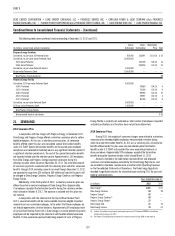
Expected Benefi t Payments: Qualifi ed Pension Plans
(in millions) Duke Energy
Duke Energy
Carolinas
Progress
Energy
Progress Energy
Carolinas
Progress
Energy Florida
Duke Energy
Ohio
Duke Energy
Indiana
Years ending December 31,
2013 $ 816 $ 250 $ 217 $ 122 $ 71 $ 36 $ 48
2014 653 214 194 105 68 35 47
2015 639 210 193 101 71 35 46
2016 636 207 196 100 74 35 46
2017 627 199 197 98 78 35 45
2018 – 2022 2,997 868 978 442 431 186 231
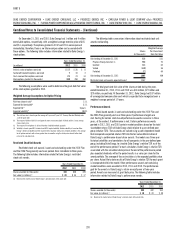
Non-Qualifi ed Pension Plans
Components of Net Periodic Pension Costs: Non-Qualifi ed Pension Plans
Year Ended December 31, 2012
(in millions) Duke Energy
Duke Energy
Carolinas
Progress
Energy
Progress Energy
Carolinas
Progress
Energy Florida
Duke Energy
Ohio
Duke Energy
Indiana
Service cost $2 $— $2 $1 $— $— $—
Interest cost on project benefi t obligation 12 1 8 1 2 — —
Amortization of actuarial loss 4 — 5 1 — — —
Amortization of prior service cost (credit) 1 — (1) — — — —
Net periodic pension costs $19 $ 1 $14 $ 3 $ 2 $— $ —
Year Ended December 31, 2011
(in millions) Duke Energy
Duke Energy
Carolinas
Progress
Energy
Progress Energy
Carolinas
Progress
Energy Florida
Duke Energy
Ohio
Duke Energy
Indiana
Service cost $ 1 $— $ 2 $ 1 $ — $ — $—
Interest cost on project benefi t obligation 8 1 9 2 2 — —
Amortization of actuarial loss — — 3 — 1 — —
Amortization of prior service cost 2 — — — — — —
Net periodic pension costs $ 11 $ 1 $ 14 $ 3 $ 3 $ — $—
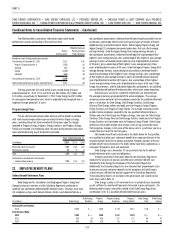
Year Ended December 31, 2010
(in millions) Duke Energy
Duke Energy
Carolinas
Progress
Energy
Progress Energy
Carolinas
Progress
Energy Florida
Duke Energy
Ohio
Duke Energy
Indiana
Service cost $ 1 $— $ 2 $ 1 $ — $ — $—
Interest cost on project benefi t obligation 9 1 9 2 2 — —
Amortization of actuarial loss — — 2 — 1 — —
Amortization of prior service cost 2 1 — — — — —
Net periodic pension costs $ 12 $ 2 $ 13 $ 3 $ 3 $ — $—