Duke Energy 2012 Annual Report Download - page 77
Download and view the complete annual report
Please find page 77 of the 2012 Duke Energy annual report below. You can navigate through the pages in the report by either clicking on the pages listed below, or by using the keyword search tool below to find specific information within the annual report.-
 1
1 -
2
-
3
-
4
-
5
-
6
-
7
-
8
-
9
-
10
-
11
-
12
-
13
-
14
-
15
-
16
-
17
-
18
-
19
-
20
-
21
-
22
-
23
-
24
-
25
-
26
-
27
-
28
-
29
-
30
-
31
-
32
-
33
-
34
-
35
-
36
-
37
-
38
-
39
-
40
-
41
-
42
-
43
-
44
-
45
-
46
-
47
-
48
-
49
-
50
-
51
-
52
-
53
-
54
-
55
-
56
-
57
-
58
-
59
-
60
-
61
-
62
-
63
-
64
-
65
-
66
-
 67
67 -
 68
68 -
 69
69 -
 70
70 -
 71
71 -
 72
72 -
 73
73 -
 74
74 -
 75
75 -
 76
76 -
 77
77 -
 78
78 -
 79
79 -
 80
80 -
 81
81 -
 82
82 -
 83
83 -
 84
84 -
 85
85 -
 86
86 -
 87
87 -
88
-
89
-
90
-
91
-
92
-
93
-
94
-
95
-
96
-
97
-
98
-
99
-
100
-
101
-
102
-
103
-
104
-
105
-
106
-
107
-
108
-
109
-
110
-
111
-
112
-
113
-
114
-
115
-
116
-
117
-
118
-
119
-
120
-
121
-
122
-
123
-
124
-
125
-
126
-
127
-
128
-
129
-
130
-
131
-
132
-
133
-
134
-
135
-
136
-
137
-
138
-
139
-
140
-
141
-
142
-
143
-
144
-
145
-
146
-
147
-
148
-
149
-
150
-
151
-
152
-
153
-
154
-
155
-
156
-
157
-
158
-
159
-
160
-
161
-
162
-
163
-
164
-
165
-
166
-
167
-
168
-
169
-
170
-
171
-
172
-
173
-
174
-
175
-
176
-
177
-
178
-
179
-
180
-
181
-
182
-
183
-
184
-
185
-
186
-
187
-
188
-
189
-
190
-
191
-
192
-
193
-
194
-
195
-
196
-
197
-
198
-
199
-
200
-
201
-
202
-
203
-
204
-
205
-
206
-
207
-
208
-
209
-
210
-
211
-
212
-
213
-
214
-
215
-
216
-
217
-
218
-
219
-
220
-
221
-
222
-
223
-
224
-
225
-
226
-
227
-
228
-
229
-
230
-
231
-
232
-
233
-
234
-
235
-
236
-
237
-
238
-
239
-
240
-
241
-
242
-
243
-
244
-
245
-
246
-
247
-
248
-
249
-
250
-
251
-
252
-
253
-
254
-
255
-
256
-
257
-
258
-
259
-
260
-
261
-
262
-
263
-
264
-
265
-
266
-
267
-
268
-
269
-
270
-
271
-
272
-
273
-
274
-
275
-
276
-
277
-
278
-
279
-
280
-
281
-
282
-
283
-
284
-
285
-
286
-
287
-
288
-
289
-
290
-
291
-
292
-
293
-
294
-
295
-
296
-
297
-
298
-
299
-
300
-
301
-
302
-
303
-
304
-
305
-
306
-
307
-
308
 |
 |

57
PART II
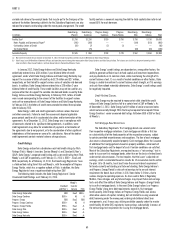
Operating Cash Flows
The following table summarizes key components of Duke Energy’s
operating cash fl ows for the three most recently completed fi scal years.
Years Ended December 31,
(in millions) 2012 2011 2010
Net income $1,782 $1,714 $1,323
Non-cash adjustments to net income 3,769 2,628 2,972
Contributions to qualifi ed pension plans (304) (200) (400)
Working capital (3) (470) 616
Net cash provided by operating activities $5,244 $3,672 $4,511
The increase in cash provided by operating activities in 2012 as compared
to 2011 was driven primarily by:
• An approximately $1,210 million increase in net income after non-cash
adjustments (depreciation and amortizations, higher Edwardsport
charges, severance expense and other Progress Energy merger related
costs), resulting from the inclusion of Progress Energy’s results
beginning July 2, 2012 and the impact of the 2011 North Carolina and
South Carolina rate cases, net of unfavorable weather; and
• A $560 million increase in traditional working capital, mainly due to
an increase in current year vacation and incentive accruals and prior
year refund of North Carolina overcollected fuels costs and current year
overcollection of North Carolina and South Carolina fuel costs, partially
offset by;
• A $100 million increase in contributions to company sponsored pension
plans due to contributions for Progress Energy pension plans.
The decrease in cash provided by operating activities in 2011 as
compared to 2010 was driven primarily by:
• Changes in traditional working capital amounts principally due to a
increase in coal inventory, resulting mainly from milder weather and
changes in the timing of payment of accounts payable and accrued
liabilities, partially offset by;
• A $200 million decrease in contributions to company sponsored pension
plans due to 2010 pre-funding of contributions resulting from favorable
borrowing conditions.
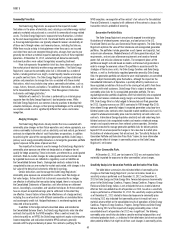
Investing Cash Flows
The following table summarizes key components of Duke Energy’s
investing cash fl ows for the three most recently completed fi scal years.
Years Ended December 31,
(in millions) 2012 2011 2010
Capital, investment and acquisition expenditures $(5,958) $(4,464) $(4,855)
Available for sale securities, net (182) (131) 95
Proceeds from sales of equity investments and other
assets, and sales of and collections on notes receivable 212 118 ) 406
Other investing items (269) 43 (69)
Net cash used in investing activities $(6,197) $(4,434) $(4,423)
The primary use of cash related to investing activities is capital,
investment and acquisition expenditures, detailed by reportable business
segment in the following table.
Years Ended December 31,
(in millions) 2012 2011 2010
U.S. Franchised Electric and Gas $4,220 $3,717 $3,891
Commercial Power 1,038 492 525
International Energy 551 114 181
Other 149 141 258
Total capital, investment and acquisition expenditures $5,958 $4,464 $4,855
The increase in cash used in investing activities in 2012 as compared to
2011 is primarily due to the following:
• A $1,490 million increase in capital, investment and acquisition
expenditures primarily due to the inclusion of Progress Energy’s capital
expenditures beginning July 2, 2012, higher expenditures on renewable
energy projects and the Chilean hydro acquisition, net of lower spending
on Duke Energy’s ongoing infrastructure modernization program as
these projects near completion and
• A $440 million increase in restricted cash primarily due to a secured
debt issuance related to Chilean hydro acquisition.
• The increase in cash used in investing activities in 2011 as compared
to 2010 is primarily due to the following:
• A $290 million decrease in proceeds from sales of equity investments
and other assets, and sales of and collections on notes receivable
as result of cash received in 2010 from the sale of a 50% interest
in DukeNet and the sale of Duke Energy’s 30% interest in Q-Comm,
partially offset by the 2011 sale of Windstream stock received in
conjunction with the Q-Comm sale in December 2010 and
• A $230 million increase in purchases of available-for-sale securities,
net of proceeds, due to the investment of excess cash held in foreign
jurisdictions.
These increases in cash used were partially offset by the following:
• A $390 million decrease in capital, investment and acquisition
expenditures primarily due to construction of the Edwardsport IGCC
plant and Cliffside Unit 6 nearing completion.
Financing Cash Flows
The following table summarizes key components of Duke Energy’s
fi nancing cash fl ows for the three most recently completed fi scal years.
Years Ended December 31,
(in millions) 2012 2011 2010
Issuance of common stock related to
employee benefi t plans $ 23 $ 67 $ 302
Issuance of long-term debt, net 1,672 2,292 1,091
Notes payable and commercial paper 278 208 (55)
Dividends paid (1,752) (1,329) (1,284)
Other fi nancing items 46 (36) (14)
Net cash provided by fi nancing activities $ 267 $ 1,202 $ 40