Duke Energy 2012 Annual Report Download - page 60
Download and view the complete annual report
Please find page 60 of the 2012 Duke Energy annual report below. You can navigate through the pages in the report by either clicking on the pages listed below, or by using the keyword search tool below to find specific information within the annual report.-
 1
1 -
2
-
3
-
4
-
5
-
6
-
7
-
8
-
9
-
10
-
11
-
12
-
13
-
14
-
15
-
16
-
17
-
18
-
19
-
20
-
21
-
22
-
23
-
24
-
25
-
26
-
27
-
28
-
29
-
30
-
31
-
32
-
33
-
34
-
35
-
36
-
37
-
38
-
39
-
40
-
41
-
42
-
43
-
44
-
45
-
46
-
47
-
48
-
49
-
 50
50 -
 51
51 -
 52
52 -
 53
53 -
 54
54 -
 55
55 -
 56
56 -
 57
57 -
 58
58 -
 59
59 -
 60
60 -
 61
61 -
 62
62 -
 63
63 -
 64
64 -
 65
65 -
 66
66 -
 67
67 -
 68
68 -
 69
69 -
 70
70 -
71
-
72
-
73
-
74
-
75
-
76
-
77
-
78
-
79
-
80
-
81
-
82
-
83
-
84
-
85
-
86
-
87
-
88
-
89
-
90
-
91
-
92
-
93
-
94
-
95
-
96
-
97
-
98
-
99
-
100
-
101
-
102
-
103
-
104
-
105
-
106
-
107
-
108
-
109
-
110
-
111
-
112
-
113
-
114
-
115
-
116
-
117
-
118
-
119
-
120
-
121
-
122
-
123
-
124
-
125
-
126
-
127
-
128
-
129
-
130
-
131
-
132
-
133
-
134
-
135
-
136
-
137
-
138
-
139
-
140
-
141
-
142
-
143
-
144
-
145
-
146
-
147
-
148
-
149
-
150
-
151
-
152
-
153
-
154
-
155
-
156
-
157
-
158
-
159
-
160
-
161
-
162
-
163
-
164
-
165
-
166
-
167
-
168
-
169
-
170
-
171
-
172
-
173
-
174
-
175
-
176
-
177
-
178
-
179
-
180
-
181
-
182
-
183
-
184
-
185
-
186
-
187
-
188
-
189
-
190
-
191
-
192
-
193
-
194
-
195
-
196
-
197
-
198
-
199
-
200
-
201
-
202
-
203
-
204
-
205
-
206
-
207
-
208
-
209
-
210
-
211
-
212
-
213
-
214
-
215
-
216
-
217
-
218
-
219
-
220
-
221
-
222
-
223
-
224
-
225
-
226
-
227
-
228
-
229
-
230
-
231
-
232
-
233
-
234
-
235
-
236
-
237
-
238
-
239
-
240
-
241
-
242
-
243
-
244
-
245
-
246
-
247
-
248
-
249
-
250
-
251
-
252
-
253
-
254
-
255
-
256
-
257
-
258
-
259
-
260
-
261
-
262
-
263
-
264
-
265
-
266
-
267
-
268
-
269
-
270
-
271
-
272
-
273
-
274
-
275
-
276
-
277
-
278
-
279
-
280
-
281
-
282
-
283
-
284
-
285
-
286
-
287
-
288
-
289
-
290
-
291
-
292
-
293
-
294
-
295
-
296
-
297
-
298
-
299
-
300
-
301
-
302
-
303
-
304
-
305
-
306
-
307
-
308
 |
 |

40
PART II
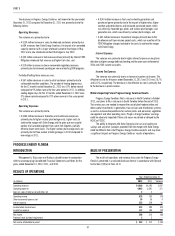
Partially offsetting these decreases was:
• A $54 million increase in purchase power to serve competitive retail
load auctions.
Other Income and Expense, net.
The variance is primarily due to the sale of certain DEGS operations and
higher equity earnings from the renewables portfolio.
Interest Expense.
The variance is primarily due to higher capitalized interest on wind
construction projects.
Income Tax (Benefi t) Expense.
The variance in tax benefi t is primarily due to a decrease in pretax
income. The effective tax rate for the years ended December 31, 2012 and 2011
was (9.5) % and (1.4) %, respectively.
Segment Income.
The variance is primarily attributable to lower revenues driven by the net
impact of the expiration of the 2009-2011 ESP and the impact of competitive
market dispatch for the Duke Energy Ohio coal-fi red assets, lower Duke Energy
Retail earnings, and lower PJM capacity revenues. These negative impacts were
partially offset by lower operating expenses, lower impairment charges, and
increased margins from the gas-fi red generation assets.
Year Ended December 31, 2011 as Compared to December 31, 2010
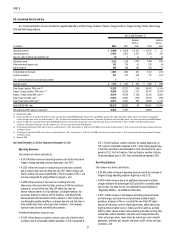
Operating Revenues.
The variance was driven primarily by:
• A $240 million increase in wholesale electric revenues due to higher
generation volumes, net of lower pricing and lower margin earned from
participation in wholesale auctions in 2011, and
• A $53 million increase in renewable generation revenues due to
additional renewable generation facilities placed in service after 2010
and a full year of operations for renewable generation facilities placed
in service throughout 2010.
Partially offsetting these increases were:
• A $178 million decrease in retail electric revenues resulting from lower sales
volumes driven by increased customer switching levels and unfavorable
weather net of higher retail pricing under the ESP in 2011, and
• A $66 million decrease in DEGS revenues, excluding renewables, due
primarily to a contract termination and plant maintenance.
Operating Expenses.
The variance was primarily driven by:
• A $584 million decrease in impairment charges primarily related to a
$660 million charge related to goodwill and nonregulated coal-fi red
generation asset impairments in the Midwest in 2010, as compared to
a $79 million impairment in 2011 to write down the carrying value of
excess emission allowances held to fair value as a result of the EPA’s
issuance of the Cross-State Air Pollution Rule (CSAPR) and a $9 million
impairment of the Vermillion generation station in 2011. See Note 12
to the Consolidated Financial Statements, “Goodwill, Intangible Assets
and Impairments,” for additional information, and
• A $65 million decrease in retail fuel and purchased power expenses due
to lower generation volumes net of higher purchased power volumes in
2011 as compared to 2010.
Partially offsetting these decreases were:
• A $156 million increase in wholesale fuel expenses due to higher
generation volumes, partially offset by favorable hedge realizations in
2011 as compared to 2010,
• A $46 million increase in operating expenses resulting primarily from
the recognition of MISO exit fees, higher maintenance expenses and
higher transmission costs, partially offset by lower governance costs in
2011 compared to 2010, and
• A $30 million increase in mark-to-market fuel expense on non-
qualifying fuel hedge contracts, consisting of mark-to-market losses of
$3 million in 2011 compared to gains of $27 million in 2010.
Other Income and Expense, net.
The variance is primarily due to distributions from South Houston Green
Power received in 2010 which did not recur in 2011.
Interest Expense.
The variance is primarily due to lower capitalized interest on wind
construction projects.
Income Tax (Benefi t) Expense.
The variance in pretax income was primarily due to a non-deductible
goodwill impairment in 2010. The effective tax rates for the year ended
December 31, 2011 and 2010, were (1.4%) and (7.2%), respectively.
Segment Income.
The variance is primarily attributable to lower goodwill, generation and
other asset impairment charges, higher wholesale margins due to increased
generation volumes, and an increase in renewables generation revenues.
These factors were partially offset by lower retail margins driven by customer
switching and unfavorable weather, higher operating expenses resulting from
the recognition of MISO exit fees and increased maintenance expenses, and net
mark-to-market losses on non-qualifying commodity hedge contracts in 2011
compared to gains in 2010.
Matters Impacting Future Commercial Power Results
Changes or variability in assumptions used in calculating the fair value
of the renewables reporting unit for goodwill testing purposes including but
not limited to, legislative actions related to tax credit extensions, long-term
growth rates and discount rates, could signifi cantly impact the estimated fair
value of the renewables reporting unit. In the event of a signifi cant decline in
the estimated fair value of the renewables reporting unit, goodwill and other
asset impairment charges could be recorded. The carrying value of goodwill,
and intangible assets associated with proposed renewable projects within
Commercial Power’s renewables reporting unit was approximately $108 million
at December 31, 2012.
The current low energy price projections, as well as recently issued and
proposed environmental regulations pertaining to coal and coal-fi red generating
facilities, could impact future cash fl ows and market valuations of Commercial
Power’s coal-fi red generation assets which could lead to impairment charges.