Duke Energy 2012 Annual Report Download - page 268
Download and view the complete annual report
Please find page 268 of the 2012 Duke Energy annual report below. You can navigate through the pages in the report by either clicking on the pages listed below, or by using the keyword search tool below to find specific information within the annual report.-
 1
1 -
2
-
3
-
4
-
5
-
6
-
7
-
8
-
9
-
10
-
11
-
12
-
13
-
14
-
15
-
16
-
17
-
18
-
19
-
20
-
21
-
22
-
23
-
24
-
25
-
26
-
27
-
28
-
29
-
30
-
31
-
32
-
33
-
34
-
35
-
36
-
37
-
38
-
39
-
40
-
41
-
42
-
43
-
44
-
45
-
46
-
47
-
48
-
49
-
50
-
51
-
52
-
53
-
54
-
55
-
56
-
57
-
58
-
59
-
60
-
61
-
62
-
63
-
64
-
65
-
66
-
67
-
68
-
69
-
70
-
71
-
72
-
73
-
74
-
75
-
76
-
77
-
78
-
79
-
80
-
81
-
82
-
83
-
84
-
85
-
86
-
87
-
88
-
89
-
90
-
91
-
92
-
93
-
94
-
95
-
96
-
97
-
98
-
99
-
100
-
101
-
102
-
103
-
104
-
105
-
106
-
107
-
108
-
109
-
110
-
111
-
112
-
113
-
114
-
115
-
116
-
117
-
118
-
119
-
120
-
121
-
122
-
123
-
124
-
125
-
126
-
127
-
128
-
129
-
130
-
131
-
132
-
133
-
134
-
135
-
136
-
137
-
138
-
139
-
140
-
141
-
142
-
143
-
144
-
145
-
146
-
147
-
148
-
149
-
150
-
151
-
152
-
153
-
154
-
155
-
156
-
157
-
158
-
159
-
160
-
161
-
162
-
163
-
164
-
165
-
166
-
167
-
168
-
169
-
170
-
171
-
172
-
173
-
174
-
175
-
176
-
177
-
178
-
179
-
180
-
181
-
182
-
183
-
184
-
185
-
186
-
187
-
188
-
189
-
190
-
191
-
192
-
193
-
194
-
195
-
196
-
197
-
198
-
199
-
200
-
201
-
202
-
203
-
204
-
205
-
206
-
207
-
208
-
209
-
210
-
211
-
212
-
213
-
214
-
215
-
216
-
217
-
218
-
219
-
220
-
221
-
222
-
223
-
224
-
225
-
226
-
227
-
228
-
229
-
230
-
231
-
232
-
233
-
234
-
235
-
236
-
237
-
238
-
239
-
240
-
241
-
242
-
243
-
244
-
245
-
246
-
247
-
248
-
249
-
250
-
251
-
252
-
253
-
254
-
255
-
256
-
257
-
 258
258 -
 259
259 -
 260
260 -
 261
261 -
 262
262 -
 263
263 -
 264
264 -
 265
265 -
 266
266 -
 267
267 -
 268
268 -
 269
269 -
 270
270 -
 271
271 -
 272
272 -
 273
273 -
 274
274 -
 275
275 -
 276
276 -
 277
277 -
 278
278 -
279
-
280
-
281
-
282
-
283
-
284
-
285
-
286
-
287
-
288
-
289
-
290
-
291
-
292
-
293
-
294
-
295
-
296
-
297
-
298
-
299
-
300
-
301
-
302
-
303
-
304
-
305
-
306
-
307
-
308
 |
 |

PART II
248
DUKE ENERGY CORPORATION • DUKE ENERGY CAROLINAS, LLC • PROGRESS ENERGY, INC. • CAROLINA POWER & LIGHT COMPANY d/b/a PROGRESS ENERGY
CAROLINAS, INC. • FLORIDA POWER CORPORATION d/b/a PROGRESS ENERY FLORIDA, INC. • DUKE ENERGY OHIO, INC. • DUKE ENERGY INDIANA, INC.
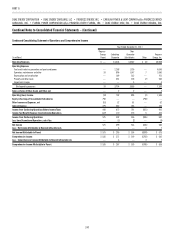
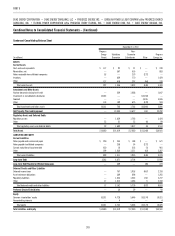
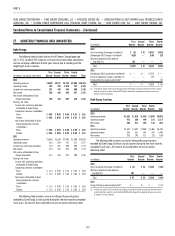
Combined Notes to Consolidated Financial Statements – (Continued)
Progress Energy
Amounts shown as N/A in the following table are due to the July 2, 2012
merger between Progress Energy and Duke Energy. Under the terms of the
merger agreement, each share of Progress Energy common stock was converted
into 0.87083 shares of Duke Energy common stock as adjusted for the one-
for-three reverse stock split of Duke Energy stock, effected in conjunction with,
and immediately prior to, the merger. Quarterly EPS amounts are meant to be
stand-alone calculations and are not always additive to full-year amount due
to rounding.
(in millions)
First
Quarter
Second
Quarter
Third
Quarter
Fourth
Quarter Total
2012
Operating revenues $2,102 $2,288 $2,788 $2,227 $ 9,405
Operating income 363 277 379 118 1,137
Income (loss) from continuing
operations 141 68 154 (8) 355
Net income 152 64 157 34 407
Net income attributable to Parent 150 63 155 32 400
Earnings per share:
Income from continuing operations
attributable to Progress Energy
common shareholders
Basic $ 0.47 $ 0.23 $ N/A $ N/A $ N/A
Diluted $ 0.47 $ 0.23 $ N/A $ N/A $ N/A
Net income attributable to Progress
Energy common shareholders
Basic $ 0.51 $ 0.21 $ N/A $ N/A $ N/A
Diluted $ 0.51 $ 0.21 $ N/A $ N/A $ N/A
2011
Operating revenues $2,174 $2,269 $2,753 $ 1,752 $ 8,948
Operating income 447 433 687 16 1,583
Income (loss) from continuing
operations 187 180 293 (73) 587
Net income (loss) 185 178 293 (74) 582
Net income (loss) attributable to
controlling interests 184 176 291 (76) 575
Earnings per share:
Income (loss) from continuing opera-
tions attributable to controlling
interests
Basic $ 0.63 $ 0.60 $ 0.98 $ (0.25) $ 1.96
Diluted $ 0.63 $ 0.60 $ 0.98 $ (0.25) $ 1.96
Net income (loss) attributable to
controlling interests
Basic $ 0.62 $ 0.60 $ 0.98 $ (0.25) $ 1.94
Diluted $ 0.62 $ 0.60 $ 0.98 $ (0.25) $ 1.94
The following table includes unusual or infrequently occurring items
recorded by Progress Energy in each quarter during the two most recently
completed fi scal years. All amounts discussed below are pre-tax unless
otherwise noted.
(in millions)
First
Quarter
Second
Quarter
Third
Quarter
Fourth
Quarter
2012
Costs to achieve the merger (see Note 2) $ (7) $(20) $ (217) $ (82)
Florida replacement power refund (see Note 4) — — (100) —
Charges related to decision to retire Crystal
River Unit 3 (see Note 4) — — — (192)
Total $ (7) $(20) $ (317) $(274)
2011
Florida customer refund (see Note 4) $— $ — $ — $(288)
CVO tender offer (see Note 15) — — (59) —
Total $— $ — $ (59) $(288)
Progress Energy Carolinas
(in millions)
First
Quarter
Second
Quarter
Third
Quarter
Fourth
Quarter Total
2012
Operating revenues $1,090 $1,090 $1,398 $1,128 $4,706
Operating income 107 83 172 148 510
Net income 52 31 96 93 272
2011
Operating revenues $1,134 $1,069 $1,331 $1,013 $4,547
Operating income 223 196 324 133 876
Net income 131 107 199 79 516
The following table includes unusual or infrequently occurring items
recorded by Progress Energy Carolinas in each quarter during the two
most recently completed fiscal years. There are no unusual or infrequent
items to report for 2011. All amounts discussed below are pre-tax unless
otherwise noted.
(in millions)
First
Quarter
Second
Quarter
Third
Quarter
Fourth
Quarter
2012
Costs to achieve the merger (see Note 2) $(4) $(12) $(180) $(36)