Duke Energy 2012 Annual Report Download - page 230
Download and view the complete annual report
Please find page 230 of the 2012 Duke Energy annual report below. You can navigate through the pages in the report by either clicking on the pages listed below, or by using the keyword search tool below to find specific information within the annual report.-
 1
1 -
2
-
3
-
4
-
5
-
6
-
7
-
8
-
9
-
10
-
11
-
12
-
13
-
14
-
15
-
16
-
17
-
18
-
19
-
20
-
21
-
22
-
23
-
24
-
25
-
26
-
27
-
28
-
29
-
30
-
31
-
32
-
33
-
34
-
35
-
36
-
37
-
38
-
39
-
40
-
41
-
42
-
43
-
44
-
45
-
46
-
47
-
48
-
49
-
50
-
51
-
52
-
53
-
54
-
55
-
56
-
57
-
58
-
59
-
60
-
61
-
62
-
63
-
64
-
65
-
66
-
67
-
68
-
69
-
70
-
71
-
72
-
73
-
74
-
75
-
76
-
77
-
78
-
79
-
80
-
81
-
82
-
83
-
84
-
85
-
86
-
87
-
88
-
89
-
90
-
91
-
92
-
93
-
94
-
95
-
96
-
97
-
98
-
99
-
100
-
101
-
102
-
103
-
104
-
105
-
106
-
107
-
108
-
109
-
110
-
111
-
112
-
113
-
114
-
115
-
116
-
117
-
118
-
119
-
120
-
121
-
122
-
123
-
124
-
125
-
126
-
127
-
128
-
129
-
130
-
131
-
132
-
133
-
134
-
135
-
136
-
137
-
138
-
139
-
140
-
141
-
142
-
143
-
144
-
145
-
146
-
147
-
148
-
149
-
150
-
151
-
152
-
153
-
154
-
155
-
156
-
157
-
158
-
159
-
160
-
161
-
162
-
163
-
164
-
165
-
166
-
167
-
168
-
169
-
170
-
171
-
172
-
173
-
174
-
175
-
176
-
177
-
178
-
179
-
180
-
181
-
182
-
183
-
184
-
185
-
186
-
187
-
188
-
189
-
190
-
191
-
192
-
193
-
194
-
195
-
196
-
197
-
198
-
199
-
200
-
201
-
202
-
203
-
204
-
205
-
206
-
207
-
208
-
209
-
210
-
211
-
212
-
213
-
214
-
215
-
216
-
217
-
218
-
219
-
 220
220 -
 221
221 -
 222
222 -
 223
223 -
 224
224 -
 225
225 -
 226
226 -
 227
227 -
 228
228 -
 229
229 -
 230
230 -
 231
231 -
 232
232 -
 233
233 -
 234
234 -
 235
235 -
 236
236 -
 237
237 -
 238
238 -
 239
239 -
 240
240 -
241
-
242
-
243
-
244
-
245
-
246
-
247
-
248
-
249
-
250
-
251
-
252
-
253
-
254
-
255
-
256
-
257
-
258
-
259
-
260
-
261
-
262
-
263
-
264
-
265
-
266
-
267
-
268
-
269
-
270
-
271
-
272
-
273
-
274
-
275
-
276
-
277
-
278
-
279
-
280
-
281
-
282
-
283
-
284
-
285
-
286
-
287
-
288
-
289
-
290
-
291
-
292
-
293
-
294
-
295
-
296
-
297
-
298
-
299
-
300
-
301
-
302
-
303
-
304
-
305
-
306
-
307
-
308
 |
 |

210
PART II
DUKE ENERGY CORPORATION • DUKE ENERGY CAROLINAS, LLC • PROGRESS ENERGY, INC. • CAROLINA POWER & LIGHT COMPANY d/b/a PROGRESS
ENERGY CAROLINAS, INC. • FLORIDA POWER CORPORATION d/b/a PROGRESS ENERY FLORIDA, INC. • DUKE ENERGY OHIO, INC. • DUKE ENERGY INDIANA, INC.
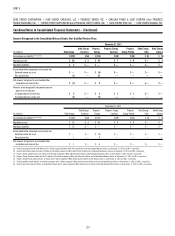
Combined Notes to Consolidated Financial Statements – (Continued)
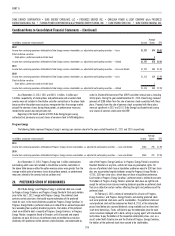
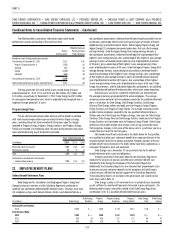
The following table summarizes information about stock-based
performance awards outstanding at the maximum level.
Shares
(in thousands)
Weighted-Average
Per Share Grant
Date Fair Value
Number of stock-based performance awards:
Outstanding at December 31, 2011 2,123 $42
Progress Energy transfers in 1,548 50
Granted 352 54
Vested (1,009) 56
Forfeited (668) 48
Outstanding at December 31, 2012 2,346 47
Stock-based performance awards expected to vest 2,132 48
The total grant date fair value of the shares vested during the years
ended December 31, 2012, 2011 and 2010 was $ 56 million, $33 million and
$15 million, respectively. At December 31, 2012, Duke Energy had $25 million
of unrecognized compensation cost, which is expected to be recognized over a
weighted-average period of 1.6 years.
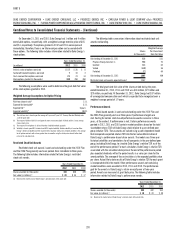
Progress Energy Plans
Pre-tax stock-based compensation expense and tax benefi t associated
with stock-based compensation expense related to former Progress Energy
plans, including those that were converted to Duke plans upon the merger,
recorded to Progress Energy, Progress Energy Carolinas, and Progress Energy
Florida are included in the following table. No stock-based compensation costs
were capitalized during any of the periods presented.
Years Ended December 31,
(in millions) 2012 2011 2010
Restricted stock unit awards $27 $24 $21
Performance awards 12 96
Total $39 $33 $27
Tax benefi t associated with stock-based
compensation expense $15 $13 $11
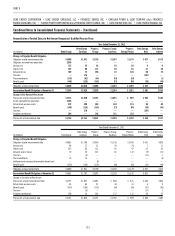
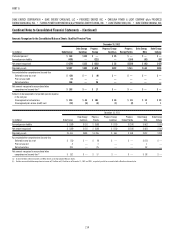
23. EMPLOYEE BENEFIT PLANS
Defi ned Benefi t Retirement Plans
Duke Energy and its subsidiaries (including legacy Progress Energy and
Cinergy businesses) maintain, and the Subsidiary Registrants participate in,
qualifi ed, non-contributory defi ned benefi t retirement plans. The plans cover most
U.S. employees using a cash balance formula. Under a cash balance formula, a
plan participant accumulates a retirement benefi t consisting of pay credits that are
based upon a percentage (which varies with age and years of service) of current
eligible earnings and current interest credits. Certain legacy Progress Energy and
legacy Cinergy U.S. employees are covered under plans that use a fi nal average
earnings formula. Under the legacy Cinergy fi nal average earnings formula, a
plan participant accumulates a retirement benefi t equal to a percentage of their
highest 3-year average earnings, plus a percentage of their highest 3-year average
earnings in excess of covered compensation per year of participation (maximum
of 35 years), plus a percentage of their highest 3-year average earnings times
years of participation in excess of 35 years. Under the legacy Progress Energy fi nal
average earnings formula, a plan participant accumulates a retirement benefi t
equal to a percentage of their highest 4-year average earnings, plus a percentage
of their highest 4-year average earnings in excess of covered compensation per
year of participation (maximum of 35 years), plus a percentage of their highest
4-year average earnings times years of participation in excess of 35 years. Duke
Energy also maintains, and the Subsidiary Registrants participate in, non-qualifi ed,
non-contributory defi ned benefi t retirement plans which cover certain executives.
Actuarial gains and losses subject to amortization are amortized over
the average remaining service period of the active employees. The average
remaining service period of active employees covered by the qualifi ed retirement
plans is nine years for Duke Energy, Duke Energy Carolinas, Duke Energy
Ohio and Duke Energy Indiana and eight years for Progress Energy, Progress
Energy Carolinas and Progress Energy Florida. The average remaining service
period of active employees covered by the non-qualifi ed retirement plans is
thirteen years for Duke Energy and Progress Energy, nine years for Duke Energy
Carolinas, Duke Energy Ohio and Duke Energy Indiana, twelve years for Progress
Energy Carolinas and seventeen years for Progress Energy Florida. Duke Energy
determines the market-related value of plan assets using a calculated value
that recognizes changes in fair value of the plan assets in a particular year on a
straight line basis over the next fi ve years.
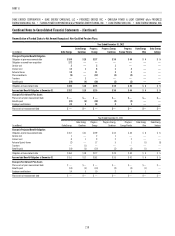
Net periodic benefi t costs disclosed in the tables below for the qualifi ed,
non-qualifi ed and other post-retirement benefi t plans represent the cost of the
respective benefi t plan for the periods presented. However, portions of the net
periodic benefi t costs disclosed in the tables below have been capitalized as a
component of property, plant and equipment.
Duke Energy uses a December 31 measurement date for its defi ned
benefi t retirement plan assets and obligations.
Amounts presented in the tables below for the Subsidiary Registrants
represent the amounts of pension and other post-retirement benefi t cost
allocated by Duke Energy for employees of the Subsidiary Registrants.
Additionally, the Subsidiary Registrants are allocated their proportionate share
of pension and post-retirement benefi t cost for employees of Duke Energy’s
shared services affi liate that provide support to the Subsidiary Registrants.
These allocated amounts are included in the governance and shared service
costs discussed in Note 14.
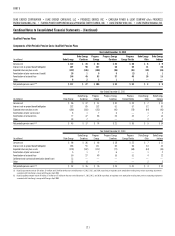
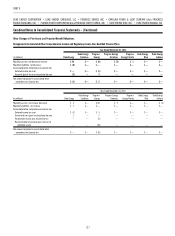
Duke Energy’s policy is to fund amounts on an actuarial basis to provide
assets suffi cient to meet benefi t payments to be paid to plan participants. The
following table includes information related to the Duke Energy Registrants’
contributions to its U.S. qualifi ed defi ned benefi t pension plans.
(in millions) Duke Energy
Duke Energy
Carolinas
Progress
Energy
Progress Energy
Carolinas
Progress
Energy Florida
Duke Energy
Ohio
Duke Energy
Indiana
Anticipated Contributions:
2013 $350 $ — $ 320 $ 94 $121 $ 18 $—
Contributions Made:
2012 $304 $ — $346 $141 $128 $— $—
2011 200 33 334 217 112 48 52
2010 400 158 129 95 34 45 46