Duke Energy 2012 Annual Report Download - page 145
Download and view the complete annual report
Please find page 145 of the 2012 Duke Energy annual report below. You can navigate through the pages in the report by either clicking on the pages listed below, or by using the keyword search tool below to find specific information within the annual report.-
 1
1 -
2
-
3
-
4
-
5
-
6
-
7
-
8
-
9
-
10
-
11
-
12
-
13
-
14
-
15
-
16
-
17
-
18
-
19
-
20
-
21
-
22
-
23
-
24
-
25
-
26
-
27
-
28
-
29
-
30
-
31
-
32
-
33
-
34
-
35
-
36
-
37
-
38
-
39
-
40
-
41
-
42
-
43
-
44
-
45
-
46
-
47
-
48
-
49
-
50
-
51
-
52
-
53
-
54
-
55
-
56
-
57
-
58
-
59
-
60
-
61
-
62
-
63
-
64
-
65
-
66
-
67
-
68
-
69
-
70
-
71
-
72
-
73
-
74
-
75
-
76
-
77
-
78
-
79
-
80
-
81
-
82
-
83
-
84
-
85
-
86
-
87
-
88
-
89
-
90
-
91
-
92
-
93
-
94
-
95
-
96
-
97
-
98
-
99
-
100
-
101
-
102
-
103
-
104
-
105
-
106
-
107
-
108
-
109
-
110
-
111
-
112
-
113
-
114
-
115
-
116
-
117
-
118
-
119
-
120
-
121
-
122
-
123
-
124
-
125
-
126
-
127
-
128
-
129
-
130
-
131
-
132
-
133
-
134
-
 135
135 -
 136
136 -
 137
137 -
 138
138 -
 139
139 -
 140
140 -
 141
141 -
 142
142 -
 143
143 -
 144
144 -
 145
145 -
 146
146 -
 147
147 -
 148
148 -
 149
149 -
 150
150 -
 151
151 -
 152
152 -
 153
153 -
 154
154 -
 155
155 -
156
-
157
-
158
-
159
-
160
-
161
-
162
-
163
-
164
-
165
-
166
-
167
-
168
-
169
-
170
-
171
-
172
-
173
-
174
-
175
-
176
-
177
-
178
-
179
-
180
-
181
-
182
-
183
-
184
-
185
-
186
-
187
-
188
-
189
-
190
-
191
-
192
-
193
-
194
-
195
-
196
-
197
-
198
-
199
-
200
-
201
-
202
-
203
-
204
-
205
-
206
-
207
-
208
-
209
-
210
-
211
-
212
-
213
-
214
-
215
-
216
-
217
-
218
-
219
-
220
-
221
-
222
-
223
-
224
-
225
-
226
-
227
-
228
-
229
-
230
-
231
-
232
-
233
-
234
-
235
-
236
-
237
-
238
-
239
-
240
-
241
-
242
-
243
-
244
-
245
-
246
-
247
-
248
-
249
-
250
-
251
-
252
-
253
-
254
-
255
-
256
-
257
-
258
-
259
-
260
-
261
-
262
-
263
-
264
-
265
-
266
-
267
-
268
-
269
-
270
-
271
-
272
-
273
-
274
-
275
-
276
-
277
-
278
-
279
-
280
-
281
-
282
-
283
-
284
-
285
-
286
-
287
-
288
-
289
-
290
-
291
-
292
-
293
-
294
-
295
-
296
-
297
-
298
-
299
-
300
-
301
-
302
-
303
-
304
-
305
-
306
-
307
-
308
 |
 |

125
PART II
Combined Notes to Consolidated Financial Statements – (Continued)
DUKE ENERGY CORPORATION • DUKE ENERGY CAROLINAS, LLC • PROGRESS ENERGY, INC. • CAROLINA POWER & LIGHT COMPANY d/b/a PROGRESS ENERGY
CAROLINAS, INC. • FLORIDA POWER CORPORATION d/b/a PROGRESS ENERY FLORIDA, INC. • DUKE ENERGY OHIO, INC. • DUKE ENERGY INDIANA, INC.
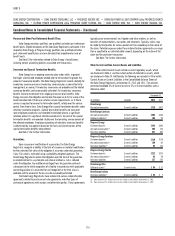
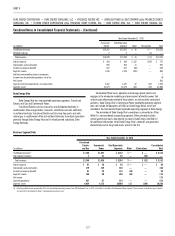
Year Ended December 31, 2010
(in millions) USFE&G
Commercial
Power
International
Energy
Total Reportable
Segments(a) Other Eliminations Total
Unaffi liated revenues $10,563 $2,440 $1,204 $14,207 $ 65 $ — $14,272
Intersegment revenues 34 8 — 42 53 (95) —
Total revenues $10,597 $2,448 $1,204 $14,249 $ 118 $(95) $14,272
Interest expense $ 569 $ 68 $ 71 $ 708 $ 132 $ — $ 840
Depreciation and amortization 1,386 225 86 1,697 89 — 1,786
Equity in earnings of unconsolidated affi liates — 7 102 109 7 — 116
Income tax expense (benefi t) 787 22 143 952 (62) — 890
Segment income(a)(b)(c) 1,380 (327) 305 1,358 (41) — 1,317
Add back noncontrolling interest component 3
Income from discontinued operations, net of tax 3
Net income 1,323
Capital investments expenditures and acquisitions 3,891 525 181 4,597 258 — 4,855
Segment assets 45,210 6,704 4,310 56,224 2,845 21 59,090
(a) Commercial Power recorded an impairment charge of $602 million, which consisted of a $500 million goodwill impairment charge associated with the nonregulated Midwest generating operations and a $102 million charge,
net of tax of $58 million, to write-down the value of certain nonregulated Midwest generating assets and emission allowances primarily associated with these generation assets.
(b) Other includes expense of $105 million, net of tax of $67 million, related to the 2010 voluntary severance plan and the consolidation of certain corporate offi ce functions from the Midwest to Charlotte, North Carolina. See Note
21 for additional information.
(c) Other recognized an $86 million gain, net of tax of $53 million, from the sale of a 50% ownership interest in DukeNet (See Note 2 for additional information), and $68 million gain, net of tax of $41 million, from the sale of an
equity method investment in Q-Comm Corporation (Q-Comm). See Note 13 for additional information.
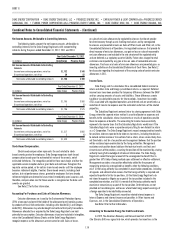
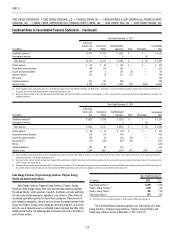
Geographic Data
(in millions) U.S.
Latin
Amereica(a) Consolidated
2012
Consolidated revenues $18,078 $1,546 $19,624
Consolidated long-lived assets 79,144 2,467 81,611
2011
Consolidated revenues $13,062 $1,467 $14,529
Consolidated long-lived assets 45,920 2,612 48,532
2010
Consolidated revenues $13,068 $1,204 $14,272
Consolidated long-lived assets 42,754 2,733 45,487
(a) Change in amounts of long-lived assets in Latin America includes foreign currency translation
adjustments on property, plant and equipment and other long-lived asset balances.
Progress Energy
Effective with the consummation of the merger with Duke Energy on July 2,
2012, Progress Energy’s reportable segments changed based on the fi nancial
information the chief decision maker evaluates for the allocation of resources
and assessing performance. Progress Energy’s sole reportable segment is now
Franchised Electric, which is primarily engaged in the generation, transmission,
distribution and sale of electricity in portions of North Carolina, South Carolina
and Florida. These electric operations also distribute and sell electricity to other
utilities, primarily on the east coast of the United States. The remainder of
Progress Energy’s operations is presented as Other. While it is not considered
an operating segment, Other primarily includes the Progress Energy holding
company and Progress Energy Service Company, LLC and other miscellaneous
nonregulated businesses, as well as costs to achieve the merger with Duke
Energy and certain governance costs allocated by its parent, Duke Energy. See
Note 14 for additional information. Also effective with the consummation of the
merger, management began evaluating segment performance based on Segment
Income. Segment Income is defi ned as income from continuing operations net of
income attributable to noncontrolling interests.
Prior periods’ segment information has been recast to conform to the
current year presentation. None of these segment changes impact Progress
Energy’s previously reported consolidated net income.