Duke Energy 2012 Annual Report Download - page 267
Download and view the complete annual report
Please find page 267 of the 2012 Duke Energy annual report below. You can navigate through the pages in the report by either clicking on the pages listed below, or by using the keyword search tool below to find specific information within the annual report.-
 1
1 -
2
-
3
-
4
-
5
-
6
-
7
-
8
-
9
-
10
-
11
-
12
-
13
-
14
-
15
-
16
-
17
-
18
-
19
-
20
-
21
-
22
-
23
-
24
-
25
-
26
-
27
-
28
-
29
-
30
-
31
-
32
-
33
-
34
-
35
-
36
-
37
-
38
-
39
-
40
-
41
-
42
-
43
-
44
-
45
-
46
-
47
-
48
-
49
-
50
-
51
-
52
-
53
-
54
-
55
-
56
-
57
-
58
-
59
-
60
-
61
-
62
-
63
-
64
-
65
-
66
-
67
-
68
-
69
-
70
-
71
-
72
-
73
-
74
-
75
-
76
-
77
-
78
-
79
-
80
-
81
-
82
-
83
-
84
-
85
-
86
-
87
-
88
-
89
-
90
-
91
-
92
-
93
-
94
-
95
-
96
-
97
-
98
-
99
-
100
-
101
-
102
-
103
-
104
-
105
-
106
-
107
-
108
-
109
-
110
-
111
-
112
-
113
-
114
-
115
-
116
-
117
-
118
-
119
-
120
-
121
-
122
-
123
-
124
-
125
-
126
-
127
-
128
-
129
-
130
-
131
-
132
-
133
-
134
-
135
-
136
-
137
-
138
-
139
-
140
-
141
-
142
-
143
-
144
-
145
-
146
-
147
-
148
-
149
-
150
-
151
-
152
-
153
-
154
-
155
-
156
-
157
-
158
-
159
-
160
-
161
-
162
-
163
-
164
-
165
-
166
-
167
-
168
-
169
-
170
-
171
-
172
-
173
-
174
-
175
-
176
-
177
-
178
-
179
-
180
-
181
-
182
-
183
-
184
-
185
-
186
-
187
-
188
-
189
-
190
-
191
-
192
-
193
-
194
-
195
-
196
-
197
-
198
-
199
-
200
-
201
-
202
-
203
-
204
-
205
-
206
-
207
-
208
-
209
-
210
-
211
-
212
-
213
-
214
-
215
-
216
-
217
-
218
-
219
-
220
-
221
-
222
-
223
-
224
-
225
-
226
-
227
-
228
-
229
-
230
-
231
-
232
-
233
-
234
-
235
-
236
-
237
-
238
-
239
-
240
-
241
-
242
-
243
-
244
-
245
-
246
-
247
-
248
-
249
-
250
-
251
-
252
-
253
-
254
-
255
-
256
-
 257
257 -
 258
258 -
 259
259 -
 260
260 -
 261
261 -
 262
262 -
 263
263 -
 264
264 -
 265
265 -
 266
266 -
 267
267 -
 268
268 -
 269
269 -
 270
270 -
 271
271 -
 272
272 -
 273
273 -
 274
274 -
 275
275 -
 276
276 -
 277
277 -
278
-
279
-
280
-
281
-
282
-
283
-
284
-
285
-
286
-
287
-
288
-
289
-
290
-
291
-
292
-
293
-
294
-
295
-
296
-
297
-
298
-
299
-
300
-
301
-
302
-
303
-
304
-
305
-
306
-
307
-
308
 |
 |

PART II
247
DUKE ENERGY CORPORATION • DUKE ENERGY CAROLINAS, LLC • PROGRESS ENERGY, INC. • CAROLINA POWER & LIGHT COMPANY d/b/a PROGRESS ENERGY
CAROLINAS, INC. • FLORIDA POWER CORPORATION d/b/a PROGRESS ENERY FLORIDA, INC. • DUKE ENERGY OHIO, INC. • DUKE ENERGY INDIANA, INC
.
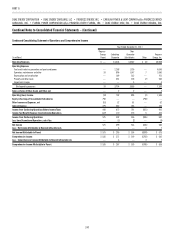
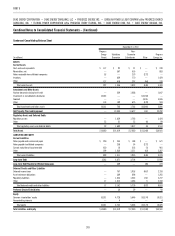
Combined Notes to Consolidated Financial Statements – (Continued)
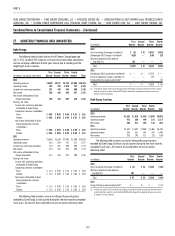
27. QUARTERLY FINANCIAL DATA (UNAUDITED)
Duke Energy
The following table includes the results of Progress Energy beginning
July 2, 2012. Quarterly EPS amounts are meant to be stand-alone calculations
and are not always additive to the full-year amount due to rounding and the
weighting of share issuances.
(in millions, except per share data)
First
Quarter
Second
Quarter
Third
Quarter
Fourth
Quarter Total
2012
Operating revenues $3,630 $3,577 $6,722 $5,695 $19,624
Operating income 495 786 1,078 767 3,126
Income from continuing operations 297 449 594 406 1,746
Net income 299 448 598 437 1,782
Net income attributable to Duke
Energy Corporation 295 444 594 435 1,768
Earnings per share:
Income from continuing operations
attributable to Duke Energy
Corporation common shareholders
Basic $ 0.66 $ 0.99 $ 0.84 $ 0.57 $ 3.01
Diluted $ 0.66 $ 0.99 $ 0.84 $ 0.57 $ 3.01
Net income attributable to Duke
Energy Corporation common
shareholders
Basic $ 0.66 $ 0.99 $ 0.85 $ 0.62 $ 3.07
Diluted $ 0.66 $ 0.99 $ 0.85 $ 0.62 $ 3.07
2011
Operating revenues $3,663 $3,534 $3,964 $3,368 $14,529
Operating income 814 679 767 517 2,777
Income from continuing operations 513 441 469 290 1,713
Net income 513 441 470 290 1,714
Net income attributable to Duke
Energy Corporation 511 435 472 288 1,706
Earnings per share:
Income from continuing operations
attributable to Duke Energy
Corporation common shareholders
Basic $ 1.15 $ 0.98 $ 1.06 $ 0.65 $ 3.83
Diluted $ 1.15 $ 0.98 $ 1.06 $ 0.65 $ 3.83
Net income attributable to Duke
Energy Corporation common
shareholders
Basic $ 1.15 $ 0.98 $ 1.06 $ 0.65 $ 3.83
Diluted $ 1.15 $ 0.98 $ 1.06 $ 0.65 $ 3.83
The following table includes unusual or infrequently occurring items
recorded by Duke Energy in each quarter during the two most recently completed
fi scal years. All amounts discussed below are pre-tax unless otherwise noted.
(in millions)
First
Quarter
Second
Quarter
Third
Quarter
Fourth
Quarter
2012
Costs to achieve the merger (see Note 2) $ (8) $ (7) $(457) $(164)
Edwardsport IGCC charges (see Note 4) (420) — (180) (28)
Voluntary Opportunity Plan deferral
(see Note 21) 101 — — —
Total $(327) $ (7) $(637) $(192)
2011
Edwardsport IGCC impairment (see Note 4) $ — $— $(222) $ —
Emission allowance charges (see Note 12) — — (79) —
Energy effi ciency revenue adjustment(a) — — — 59
Total $ — $— $(301) $ 59
(a) In the fourth quarter of 2011, Duke Energy recorded $59 million of previously deferred revenue resulting
from the receipt of an order from the NCUC which allowed the recognition of revenue in excess of
amounts billed to customers.
Duke Energy Carolinas
(in millions)
First
Quarter
Second
Quarter
Third
Quarter
Fourth
Quarter Total
2012
Operating revenues $1,501 $1,616 $1,939 $1,609 $6,665
Operating income 475 386 440 216 1,517
Net income 266 211 258 130 865
2011
Operating revenues $1,552 $1,607 $1,868 $1,466 $6,493
Operating income 363 331 541 245 1,480
Net income 205 193 311 125 834
The following table includes unusual or infrequently occurring items
recorded by Duke Energy Carolinas in each quarter during the two most recently
completed fi scal years. All amounts discussed below are pre-tax unless
otherwise noted.
(in millions)
First
Quarter
Second
Quarter
Third
Quarter
Fourth
Quarter
2012
Costs to achieve the merger (see Note 2) $ (4) $ (5) $(184) $(46)
Voluntary Opportunity Plan deferral
(see Note 21) 101 — — —
Total $ 97 $ (5) $(184) $(46)
2011
Energy effi ciency revenue adjustment(a) $ — $— $ — $ 59
(a) In the fourth quarter of 2011, Duke Energy Carolinas recorded $59 million of previously deferred revenue
resulting from the receipt of an order from the NCUC which allowed the recognition of revenue in excess
of amounts billed to customers.