Duke Energy 2012 Annual Report Download - page 201
Download and view the complete annual report
Please find page 201 of the 2012 Duke Energy annual report below. You can navigate through the pages in the report by either clicking on the pages listed below, or by using the keyword search tool below to find specific information within the annual report.-
 1
1 -
2
-
3
-
4
-
5
-
6
-
7
-
8
-
9
-
10
-
11
-
12
-
13
-
14
-
15
-
16
-
17
-
18
-
19
-
20
-
21
-
22
-
23
-
24
-
25
-
26
-
27
-
28
-
29
-
30
-
31
-
32
-
33
-
34
-
35
-
36
-
37
-
38
-
39
-
40
-
41
-
42
-
43
-
44
-
45
-
46
-
47
-
48
-
49
-
50
-
51
-
52
-
53
-
54
-
55
-
56
-
57
-
58
-
59
-
60
-
61
-
62
-
63
-
64
-
65
-
66
-
67
-
68
-
69
-
70
-
71
-
72
-
73
-
74
-
75
-
76
-
77
-
78
-
79
-
80
-
81
-
82
-
83
-
84
-
85
-
86
-
87
-
88
-
89
-
90
-
91
-
92
-
93
-
94
-
95
-
96
-
97
-
98
-
99
-
100
-
101
-
102
-
103
-
104
-
105
-
106
-
107
-
108
-
109
-
110
-
111
-
112
-
113
-
114
-
115
-
116
-
117
-
118
-
119
-
120
-
121
-
122
-
123
-
124
-
125
-
126
-
127
-
128
-
129
-
130
-
131
-
132
-
133
-
134
-
135
-
136
-
137
-
138
-
139
-
140
-
141
-
142
-
143
-
144
-
145
-
146
-
147
-
148
-
149
-
150
-
151
-
152
-
153
-
154
-
155
-
156
-
157
-
158
-
159
-
160
-
161
-
162
-
163
-
164
-
165
-
166
-
167
-
168
-
169
-
170
-
171
-
172
-
173
-
174
-
175
-
176
-
177
-
178
-
179
-
180
-
181
-
182
-
183
-
184
-
185
-
186
-
187
-
188
-
189
-
190
-
 191
191 -
 192
192 -
 193
193 -
 194
194 -
 195
195 -
 196
196 -
 197
197 -
 198
198 -
 199
199 -
 200
200 -
 201
201 -
 202
202 -
 203
203 -
 204
204 -
 205
205 -
 206
206 -
 207
207 -
 208
208 -
 209
209 -
 210
210 -
 211
211 -
212
-
213
-
214
-
215
-
216
-
217
-
218
-
219
-
220
-
221
-
222
-
223
-
224
-
225
-
226
-
227
-
228
-
229
-
230
-
231
-
232
-
233
-
234
-
235
-
236
-
237
-
238
-
239
-
240
-
241
-
242
-
243
-
244
-
245
-
246
-
247
-
248
-
249
-
250
-
251
-
252
-
253
-
254
-
255
-
256
-
257
-
258
-
259
-
260
-
261
-
262
-
263
-
264
-
265
-
266
-
267
-
268
-
269
-
270
-
271
-
272
-
273
-
274
-
275
-
276
-
277
-
278
-
279
-
280
-
281
-
282
-
283
-
284
-
285
-
286
-
287
-
288
-
289
-
290
-
291
-
292
-
293
-
294
-
295
-
296
-
297
-
298
-
299
-
300
-
301
-
302
-
303
-
304
-
305
-
306
-
307
-
308
 |
 |

181
PART II
DUKE ENERGY CORPORATION • DUKE ENERGY CAROLINAS, LLC • PROGRESS ENERGY, INC. • CAROLINA POWER & LIGHT COMPANY d/b/a PROGRESS ENERGY
CAROLINAS, INC. • FLORIDA POWER CORPORATION d/b/a PROGRESS ENERY FLORIDA, INC. • DUKE ENERGY OHIO, INC. • DUKE ENERGY INDIANA, INC
.
Combined Notes to Consolidated Financial Statements – (Continued)
Foreign equity prices are translated from their trading currency using the currency
exchange rate in effect at the close of the principal active market. Prices have not
been adjusted to refl ect for after-hours market activity. The majority of investments
in equity securities are valued using Level 1 measurements. For certain
investments that are valued on a net asset value per share (or its equivalent),
or the net asset value basis, when the Duke Energy Registrants do not have the
ability to redeem the investment in the near term at net asset value per share (or
its equivalent), or the net asset value is not available as of the measurement date,
the fair value measurement of the investment is categorized as Level 3.
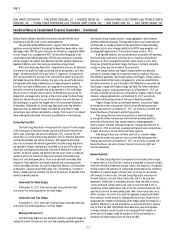
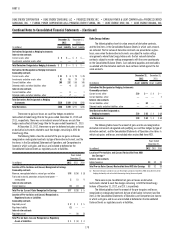
Investments in available-for-sale auction rate securities.
Duke Energy and Duke Energy Carolinas hold auction rate securities
for which an active market does not currently exist. During the year ended
December 31, 2012, $55 million of these investments in auction rate securities
were redeemed at full par value plus accrued interest. Auction rate securities
held are student loan securities for which at December 31, 2012 approximately
84% is ultimately backed by the U.S. government. At December 31, 2012,
approximately 24% of these securities are AAA rated. As of December 31,
2012, and 2011 all of these auction rate securities are classifi ed as long-term
investments and are valued using Level 3 measurements. The methods and
signifi cant assumptions used to determine the fair values of the investment in
auction rate debt securities represent estimations of fair value using internal
discounted cash fl ow models which incorporate primarily management’s own
assumptions as to the term over which such investments will be recovered at
par (ranging from 7 to 17 years), the current level of interest rates (less than
0.3%), and the appropriate risk-adjusted discount rates (up to 4.2% refl ecting a
tenor of up to 17 years). In preparing the valuations, all signifi cant value drivers
were considered, including the underlying collateral (primarily evaluated on the
basis of credit ratings, parity ratios and the percentage of loans backed by the
U.S. government).
There were no other-than-temporary impairments associated
with investments in auction rate debt securities during the years ended
December 31, 2012 or 2011.
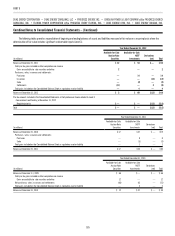
Investments in debt securities.
Most debt investments, including those held in the Nuclear
Decommissioning Trust Funds (NDTF), are valued based on a calculation using
interest rate curves and credit spreads applied to the terms of the debt instrument
(maturity and coupon interest rate) and consider the counterparty credit rating.
Most debt valuations are Level 2 measurements. If the market for a particular
fi xed income security is relatively inactive or illiquid, the measurement is a Level 3
measurement. U.S. Treasury debt is typically a Level 1 measurement.
Commodity derivatives.
The pricing for commodity derivatives is primarily a calculated value
which incorporates the forward price and is adjusted for liquidity (bid-ask
spread), credit or non-performance risk (after refl ecting credit enhancements
such as collateral) and discounted to present value. The primary difference
between a Level 2 and a Level 3 measurement relates to the level of activity
in forward markets for the commodity. If the market is relatively inactive, the
measurement is deemed to be a Level 3 measurement. Commodity derivatives
with clearinghouses are classifi ed as Level 1 measurements. For commodity
derivative contracts classifi ed as Level 3, Duke Energy utilizes internally-
developed fi nancial models based upon the income approach (discounted cash
fl ow method) are utilized to measure the fair values. The primary inputs to
these models are the forward commodity prices used to develop the forward
price curves for the respective instrument. The pricing inputs are derived from
published exchange transaction prices and other observable or public data
sources. In the absence of observable market information that supports the
pricing inputs, there is a presumption that the transaction price is equal to
the last observable price for a similar period. For the commodity derivative
contracts classifi ed as Level 3, the pricing inputs for natural gas and electricity
forward price curves are not observable for the full term of the related contracts.
In isolation, increases (decreases) in unobservable natural gas forward prices
would result in favorable (unfavorable) fair value adjustments for gas purchase
contracts. In isolation, increases (decreases) in unobservable electricity
forward prices would result in unfavorable (favorable) fair value adjustments
for electricity sales contracts. Duke Energy regularly evaluates and validates the
pricing inputs used to estimate fair value of gas purchase contracts by a market
participant price verifi cation procedure, which provides a comparison of internal
forward commodity curves to market participant generated curves.
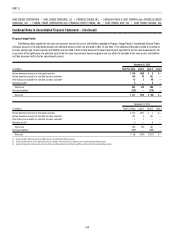
Contingent Value Obligations (CVO).
Progress Energy issued CVOs, which are derivatives, in connection
with the acquisition of Florida Progress Corporation (Florida Progress). In
November 2011, Progress Energy commenced a public tender offer that expired
on February 15, 2012. At December 31, 2012, and 2011 all CVOs not tendered,
have been classifi ed as Level 2 based on observable prices in the less-than-
active market.
In connection with the acquisition of Florida Progress during 2000, the
Progress Energy parent issued 98.6 million CVOs. Each CVO represents the
right of the holder to receive contingent payments based on the performance
of four coal-based solid synthetic fuels limited liability companies purchased
by subsidiaries of Florida Progress in October 1999. All of Progress Energy’s
synthetic fuels businesses were abandoned and all operations ceased as of
December 31, 2007. The payments are based on the net after-tax cash fl ows
the facilities generated. Progress Energy makes deposits into a CVO trust
for estimated contingent payments due to CVO holders based on the results
of operations and the utilization of tax credits. The balance of the CVO trust
at December 31, 2012 and 2011, was $11 million and is included in Other
within Investments and Other Assets on the Consolidated Balance Sheets.
Future payments from the trust to CVO holders will not be made until certain
conditions are satisfi ed and will include principal and interest earned during the
investment period, net of expenses deducted. Interest earned on the payments
held in trust for 2012 and 2011 were insignifi cant.
In October 2011, Progress Energy entered a settlement agreement and
release with a plaintiff under which the parties mutually released all claims
related to the CVOs and Progress Energy purchased all of the plaintiff’s CVOs
at a negotiated purchase price of $0.75 per CVO. In November 2011, Progress
Energy also commenced a tender offer for all remaining outstanding CVOs at the
same purchase price. The tender offer expired on February 15, 2012. Progress
Energy repurchased 83.4 million CVOs through the settlement agreement or
through the tender offer. The CVOs are derivatives and are recorded at fair value.
In 2011, pre-tax losses of $59 million from changes in fair value were recorded
in Other Income and Expenses, net on the Consolidated Statements of Income.
At December 31, 2012, the CVO liability included in Other within Deferred
Credits and Other Liabilities on the Consolidated Balance Sheets was $4 million
based on the 15.2 million outstanding CVOs not held by the Progress Energy
parent. At December 31, 2011, the CVO liability included in Other within Current
Liabilities on the Consolidated Balance Sheets was $14 million based on the
18.5 million CVOs outstanding not held by the Progress Energy parent.