Duke Energy 2012 Annual Report Download - page 149
Download and view the complete annual report
Please find page 149 of the 2012 Duke Energy annual report below. You can navigate through the pages in the report by either clicking on the pages listed below, or by using the keyword search tool below to find specific information within the annual report.-
 1
1 -
2
-
3
-
4
-
5
-
6
-
7
-
8
-
9
-
10
-
11
-
12
-
13
-
14
-
15
-
16
-
17
-
18
-
19
-
20
-
21
-
22
-
23
-
24
-
25
-
26
-
27
-
28
-
29
-
30
-
31
-
32
-
33
-
34
-
35
-
36
-
37
-
38
-
39
-
40
-
41
-
42
-
43
-
44
-
45
-
46
-
47
-
48
-
49
-
50
-
51
-
52
-
53
-
54
-
55
-
56
-
57
-
58
-
59
-
60
-
61
-
62
-
63
-
64
-
65
-
66
-
67
-
68
-
69
-
70
-
71
-
72
-
73
-
74
-
75
-
76
-
77
-
78
-
79
-
80
-
81
-
82
-
83
-
84
-
85
-
86
-
87
-
88
-
89
-
90
-
91
-
92
-
93
-
94
-
95
-
96
-
97
-
98
-
99
-
100
-
101
-
102
-
103
-
104
-
105
-
106
-
107
-
108
-
109
-
110
-
111
-
112
-
113
-
114
-
115
-
116
-
117
-
118
-
119
-
120
-
121
-
122
-
123
-
124
-
125
-
126
-
127
-
128
-
129
-
130
-
131
-
132
-
133
-
134
-
135
-
136
-
137
-
138
-
 139
139 -
 140
140 -
 141
141 -
 142
142 -
 143
143 -
 144
144 -
 145
145 -
 146
146 -
 147
147 -
 148
148 -
 149
149 -
 150
150 -
 151
151 -
 152
152 -
 153
153 -
 154
154 -
 155
155 -
 156
156 -
 157
157 -
 158
158 -
 159
159 -
160
-
161
-
162
-
163
-
164
-
165
-
166
-
167
-
168
-
169
-
170
-
171
-
172
-
173
-
174
-
175
-
176
-
177
-
178
-
179
-
180
-
181
-
182
-
183
-
184
-
185
-
186
-
187
-
188
-
189
-
190
-
191
-
192
-
193
-
194
-
195
-
196
-
197
-
198
-
199
-
200
-
201
-
202
-
203
-
204
-
205
-
206
-
207
-
208
-
209
-
210
-
211
-
212
-
213
-
214
-
215
-
216
-
217
-
218
-
219
-
220
-
221
-
222
-
223
-
224
-
225
-
226
-
227
-
228
-
229
-
230
-
231
-
232
-
233
-
234
-
235
-
236
-
237
-
238
-
239
-
240
-
241
-
242
-
243
-
244
-
245
-
246
-
247
-
248
-
249
-
250
-
251
-
252
-
253
-
254
-
255
-
256
-
257
-
258
-
259
-
260
-
261
-
262
-
263
-
264
-
265
-
266
-
267
-
268
-
269
-
270
-
271
-
272
-
273
-
274
-
275
-
276
-
277
-
278
-
279
-
280
-
281
-
282
-
283
-
284
-
285
-
286
-
287
-
288
-
289
-
290
-
291
-
292
-
293
-
294
-
295
-
296
-
297
-
298
-
299
-
300
-
301
-
302
-
303
-
304
-
305
-
306
-
307
-
308
 |
 |

129
PART II
Combined Notes to Consolidated Financial Statements – (Continued)
DUKE ENERGY CORPORATION • DUKE ENERGY CAROLINAS, LLC • PROGRESS ENERGY, INC. • CAROLINA POWER & LIGHT COMPANY d/b/a PROGRESS ENERGY
CAROLINAS, INC. • FLORIDA POWER CORPORATION d/b/a PROGRESS ENERY FLORIDA, INC. • DUKE ENERGY OHIO, INC. • DUKE ENERGY INDIANA, INC.
4. REGULATORY MATTERS
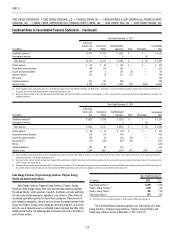
Regulatory Assets and Liabilities
As of December 31, 2012 and 2011, the substantial majority of USFE&G’s operations applied regulatory accounting treatment. Accordingly, these businesses
record assets and liabilities that result from the regulated ratemaking process that would not be recorded under GAAP for non regulated entities. See Note 1 for further
information.
The following tables represent the regulatory assets and liabilities on the Duke Energy Registrant’s Consolidated Balance Sheets:
As of December 31, 2012
(in millions)
Duke
Energy
Duke
Energy
Carolinas
Progress
Energy
Progress
Energy
Carolinas
Progress
Energy
Florida
Duke
Energy
Ohio
Duke
Energy
Indiana
Regulatory Assets
Vacation accrual $ 245 $ 85 $ 65 $ 65 $ — $ 7 $ 13
Nuclear deferral 65 — 65 — 65 — —
Demand side management (DSM) costs/Energy effi ciency (EE) 58 36 — — — 22 —
Deferred fuel costs 162 — 109 — 109 1 52
Over-distribution of Bulk Power Marketing (BPM) sharing 43 43 — — — — —
Post in-service carrying costs and deferred operating expenses 29 27 — — — — 2
Gasifi cation services agreement buyout costs 25 — — — — — 25
Other 110 30 17 12 5 16 34
Total Current Regulatory Assets(a) 737 221 256 77 179 46 126
Accrued pension and post-retirement 3,306 602 1,650 769 754 225 325
Retired generation facilities 1,781 — 1,720 128 1,592 — 61
Debt fair value adjustment 1,472 — — — — — —
Asset retirement obligations 1,461 48 713 372 341 — —
Net regulatory asset related to income taxes 1,373 731 401 175 226 82 158
Hedge costs and other deferrals 710 88 550 240 310 9 63
DSM costs/Energy effi ciency 264 71 121 121 — 72 —
Post in-service carrying costs and deferred operating expenses 93 — — — — 19 74
Regional Transmission Organization (RTO) costs 83 10 5 5 — 72 —
Manufactured gas plant (MGP) costs 77 — — — — 77 —
Gasifi cation services agreement buyout costs 70 — — — — — 70
Nuclear deferral 77 — 77 — 77 — —
Other 237 177 55 35 21 23 59
Total Non-Current Regulatory Assets 11,004 1,727 5,292 1,845 3,321 579 810
Total Regulatory Assets $11,741 $1,948 $5,548 $1,922 $3,500 $625 $936