Duke Energy 2012 Annual Report Download - page 200
Download and view the complete annual report
Please find page 200 of the 2012 Duke Energy annual report below. You can navigate through the pages in the report by either clicking on the pages listed below, or by using the keyword search tool below to find specific information within the annual report.-
 1
1 -
2
-
3
-
4
-
5
-
6
-
7
-
8
-
9
-
10
-
11
-
12
-
13
-
14
-
15
-
16
-
17
-
18
-
19
-
20
-
21
-
22
-
23
-
24
-
25
-
26
-
27
-
28
-
29
-
30
-
31
-
32
-
33
-
34
-
35
-
36
-
37
-
38
-
39
-
40
-
41
-
42
-
43
-
44
-
45
-
46
-
47
-
48
-
49
-
50
-
51
-
52
-
53
-
54
-
55
-
56
-
57
-
58
-
59
-
60
-
61
-
62
-
63
-
64
-
65
-
66
-
67
-
68
-
69
-
70
-
71
-
72
-
73
-
74
-
75
-
76
-
77
-
78
-
79
-
80
-
81
-
82
-
83
-
84
-
85
-
86
-
87
-
88
-
89
-
90
-
91
-
92
-
93
-
94
-
95
-
96
-
97
-
98
-
99
-
100
-
101
-
102
-
103
-
104
-
105
-
106
-
107
-
108
-
109
-
110
-
111
-
112
-
113
-
114
-
115
-
116
-
117
-
118
-
119
-
120
-
121
-
122
-
123
-
124
-
125
-
126
-
127
-
128
-
129
-
130
-
131
-
132
-
133
-
134
-
135
-
136
-
137
-
138
-
139
-
140
-
141
-
142
-
143
-
144
-
145
-
146
-
147
-
148
-
149
-
150
-
151
-
152
-
153
-
154
-
155
-
156
-
157
-
158
-
159
-
160
-
161
-
162
-
163
-
164
-
165
-
166
-
167
-
168
-
169
-
170
-
171
-
172
-
173
-
174
-
175
-
176
-
177
-
178
-
179
-
180
-
181
-
182
-
183
-
184
-
185
-
186
-
187
-
188
-
189
-
 190
190 -
 191
191 -
 192
192 -
 193
193 -
 194
194 -
 195
195 -
 196
196 -
 197
197 -
 198
198 -
 199
199 -
 200
200 -
 201
201 -
 202
202 -
 203
203 -
 204
204 -
 205
205 -
 206
206 -
 207
207 -
 208
208 -
 209
209 -
 210
210 -
211
-
212
-
213
-
214
-
215
-
216
-
217
-
218
-
219
-
220
-
221
-
222
-
223
-
224
-
225
-
226
-
227
-
228
-
229
-
230
-
231
-
232
-
233
-
234
-
235
-
236
-
237
-
238
-
239
-
240
-
241
-
242
-
243
-
244
-
245
-
246
-
247
-
248
-
249
-
250
-
251
-
252
-
253
-
254
-
255
-
256
-
257
-
258
-
259
-
260
-
261
-
262
-
263
-
264
-
265
-
266
-
267
-
268
-
269
-
270
-
271
-
272
-
273
-
274
-
275
-
276
-
277
-
278
-
279
-
280
-
281
-
282
-
283
-
284
-
285
-
286
-
287
-
288
-
289
-
290
-
291
-
292
-
293
-
294
-
295
-
296
-
297
-
298
-
299
-
300
-
301
-
302
-
303
-
304
-
305
-
306
-
307
-
308
 |
 |

180
PART II
DUKE ENERGY CORPORATION • DUKE ENERGY CAROLINAS, LLC • PROGRESS ENERGY, INC. • CAROLINA POWER & LIGHT COMPANY d/b/a PROGRESS ENERGY
CAROLINAS, INC. • FLORIDA POWER CORPORATION d/b/a PROGRESS ENERY FLORIDA, INC. • DUKE ENERGY OHIO, INC. • DUKE ENERGY INDIANA, INC.
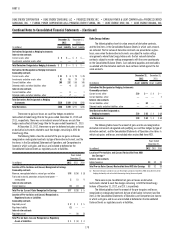
Combined Notes to Consolidated Financial Statements – (Continued)
December 31, 2012 December 31, 2011
(in millions) Receivables Payables Receivables Payables
Duke Energy
Amounts offset against net derivative positions $ 73 $— $ 10 $—
Amounts not offset against net derivative positions 93 — 30 —
Progress Energy
Amounts offset against net derivative positions 58 — 140 —
Amounts not offset against net derivative positions 1 — 3 —
Progress Energy Carolinas
Amounts offset against net derivative positions 9 — 23 —
Amounts not offset against net derivative positions —— ——
Progress Energy Florida
Amounts offset against net derivative positions 49 — 117 —
Amounts not offset against net derivative positions 1 — 3 —
Duke Energy Ohio
Amounts offset against net derivative positions 15 — 9 —
Amounts not offset against net derivative positions 92 — 28 —
16. FAIR VALUE OF FINANCIAL ASSETS AND LIABILITIES
Under existing accounting guidance, fair value is considered to be the
exchange price in an orderly transaction between market participants to sell an
asset or transfer a liability at the measurement date. The fair value defi nition
focuses on an exit price, which is the price that would be received to sell an
asset or paid to transfer a liability versus an entry price, which would be the
price paid to acquire an asset or received to assume a liability. Fair value
measurements require the use of market data or assumptions that market
participants would use in pricing the asset or liability, including assumptions
about risk and the risks inherent in the inputs to the valuation technique. These
inputs can be readily observable, corroborated by market data or generally
unobservable. Valuation techniques are required to maximize the use of
observable inputs and minimize the use of unobservable inputs. A midmarket
pricing convention (the midpoint price between bid and ask prices) is permitted
for use as a practical expedient.
The Duke Energy Registrants classify recurring and non-recurring fair
value measurements based on the following fair value hierarchy, as prescribed
by the accounting guidance for fair value. The hierarchy prioritizes the inputs to
valuation techniques used to measure fair value into three levels:
Level 1 — unadjusted quoted prices in active markets for identical
assets or liabilities the Duke Energy Registrants have the ability to access.
An active market for the asset or liability is one in which transactions for
the asset or liability occur with suffi cient frequency and volume to provide
ongoing pricing information. The Duke Energy Registrants’ Level 1 primarily
consists of fi nancial instruments such as exchange-traded derivatives
and listed equities.
Level 2 — a fair value measurement utilizing inputs other than a quoted
market price that are observable, either directly or indirectly, for the
asset or liability. Level 2 inputs include, but are not limited to, quoted
prices for similar assets or liabilities in an active market, quoted prices
for identical or similar assets or liabilities in markets that are not active
and inputs other than quoted market prices that are observable for the
asset or liability, such as interest rate curves and yield curves observable
at commonly quoted intervals, volatilities, credit risk and default rates.
A Level 2 measurement cannot have more than an insignifi cant portion of
the valuation based on unobservable inputs. Instruments in this category
include non-exchange-traded derivatives, such as over-the-counter
forwards, swaps and options; certain marketable debt securities; and
fi nancial instruments traded in less than active markets.
Level 3 — any fair value measurements which include unobservable inputs
for the asset or liability for more than an insignifi cant portion of the valuation.
These inputs may be used with internally developed methodologies that
result in management’s best estimate of fair value. Level 3 instruments may
include longer-term instruments that extend into periods in which quoted
prices or other observable inputs are not available.
The fair value accounting guidance for fi nancial instruments permits
entities to elect to measure many fi nancial instruments and certain other items
at fair value that are not required to be accounted for at fair value under other
GAAP. There are no fi nancial assets or fi nancial liabilities that are not required to
be accounted for at fair value under GAAP for which the option to record at fair
value has been elected by the Duke Energy Registrants. However, in the future,
the Duke Energy Registrants may elect to measure certain fi nancial instruments
at fair value in accordance with this accounting guidance.
Transfers out of and into Levels 1, 2 or 3 represent existing assets or
liabilities previously categorized as a higher level for which the inputs to the
estimate became less observable or assets and liabilities that were previously
classifi ed as Level 2 or 3 for which the lowest signifi cant input became more
observable during the period, respectively. The Duke Energy Registrant’s policy
for the recognition of transfers between levels of the fair value hierarchy is to
recognize the transfer at the end of the period. There were no transfers out of or
into Levels 1, 2 and 3 during the year ended December 31, 2012.
Valuation methods of the primary fair value measurements disclosed
below are as follows:
Investments in equity securities.
Investments in equity securities, other than those accounted for as equity
and cost method investments, are typically valued at the closing price in the
principal active market as of the last business day of the quarter. Principal active
markets for equity prices include published exchanges such as NASDAQ and NYSE.