Duke Energy 2012 Annual Report Download - page 106
Download and view the complete annual report
Please find page 106 of the 2012 Duke Energy annual report below. You can navigate through the pages in the report by either clicking on the pages listed below, or by using the keyword search tool below to find specific information within the annual report.-
 1
1 -
2
-
3
-
4
-
5
-
6
-
7
-
8
-
9
-
10
-
11
-
12
-
13
-
14
-
15
-
16
-
17
-
18
-
19
-
20
-
21
-
22
-
23
-
24
-
25
-
26
-
27
-
28
-
29
-
30
-
31
-
32
-
33
-
34
-
35
-
36
-
37
-
38
-
39
-
40
-
41
-
42
-
43
-
44
-
45
-
46
-
47
-
48
-
49
-
50
-
51
-
52
-
53
-
54
-
55
-
56
-
57
-
58
-
59
-
60
-
61
-
62
-
63
-
64
-
65
-
66
-
67
-
68
-
69
-
70
-
71
-
72
-
73
-
74
-
75
-
76
-
77
-
78
-
79
-
80
-
81
-
82
-
83
-
84
-
85
-
86
-
87
-
88
-
89
-
90
-
91
-
92
-
93
-
94
-
95
-
 96
96 -
 97
97 -
 98
98 -
 99
99 -
 100
100 -
 101
101 -
 102
102 -
 103
103 -
 104
104 -
 105
105 -
 106
106 -
 107
107 -
 108
108 -
 109
109 -
 110
110 -
 111
111 -
 112
112 -
 113
113 -
 114
114 -
 115
115 -
 116
116 -
117
-
118
-
119
-
120
-
121
-
122
-
123
-
124
-
125
-
126
-
127
-
128
-
129
-
130
-
131
-
132
-
133
-
134
-
135
-
136
-
137
-
138
-
139
-
140
-
141
-
142
-
143
-
144
-
145
-
146
-
147
-
148
-
149
-
150
-
151
-
152
-
153
-
154
-
155
-
156
-
157
-
158
-
159
-
160
-
161
-
162
-
163
-
164
-
165
-
166
-
167
-
168
-
169
-
170
-
171
-
172
-
173
-
174
-
175
-
176
-
177
-
178
-
179
-
180
-
181
-
182
-
183
-
184
-
185
-
186
-
187
-
188
-
189
-
190
-
191
-
192
-
193
-
194
-
195
-
196
-
197
-
198
-
199
-
200
-
201
-
202
-
203
-
204
-
205
-
206
-
207
-
208
-
209
-
210
-
211
-
212
-
213
-
214
-
215
-
216
-
217
-
218
-
219
-
220
-
221
-
222
-
223
-
224
-
225
-
226
-
227
-
228
-
229
-
230
-
231
-
232
-
233
-
234
-
235
-
236
-
237
-
238
-
239
-
240
-
241
-
242
-
243
-
244
-
245
-
246
-
247
-
248
-
249
-
250
-
251
-
252
-
253
-
254
-
255
-
256
-
257
-
258
-
259
-
260
-
261
-
262
-
263
-
264
-
265
-
266
-
267
-
268
-
269
-
270
-
271
-
272
-
273
-
274
-
275
-
276
-
277
-
278
-
279
-
280
-
281
-
282
-
283
-
284
-
285
-
286
-
287
-
288
-
289
-
290
-
291
-
292
-
293
-
294
-
295
-
296
-
297
-
298
-
299
-
300
-
301
-
302
-
303
-
304
-
305
-
306
-
307
-
308
 |
 |

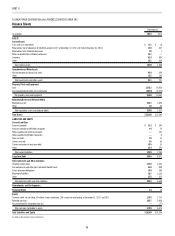
86
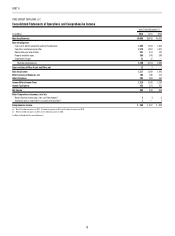
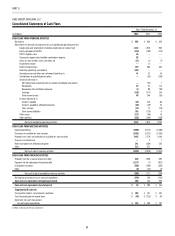
PART II
PROGRESS ENERGY, INC.
Consolidated Statements of Cash Flows
Years Ended December 31,
(in millions) 2012 2011 2010
CASH FLOWS FROM OPERATING ACTIVITIES
Net income $ 407 $ 582 $ 863
Adjustments to reconcile net income to net cash provided by operating activities:
Depreciation, amortization and accretion (including amortization of nuclear fuel) 897 850 1,044
Equity component of AFUDC (106) (103) (92)
Severance expense 38 — —
FERC mitigation costs 71 — —
Community support and charitable contributions expense 36 — —
Gains (losses) on sales of other assets and other, net (16) (5) 9
Impairment charges 146 3 5
Deferred income taxes 263 353 478
Amount to be refunded to customers 100 288 —
Accrued pension and other post-retirement benefi t costs 179 124 121
Contributions to qualifi ed pension plans (346) (331) (129)
(Increase) decrease in
Net realized and unrealized mark-to-market and hedging transactions 7 (10) (17)
Receivables 49 167 (178)
Receivables from affi liated companies (15) — —
Inventory (71) (210) 89
Other current assets 2 (111) 84
Increase (decrease) in
Accounts payable 175 (64) 115
Accounts payable to affi liated companies 30 — —
Taxes accrued 25 (16) 26
Other current liabilities 81 67 78
Other assets (25) (67) (25)
Other liabilities (87) 98 60
Net cash provided by operating activities 1,840 1,615 2,531
CASH FLOWS FROM INVESTING ACTIVITIES
Capital expenditures (2,366) (2,256) (2,445)
Purchases of available-for-sale securities (1,374) (5,017) (7,009)
Proceeds from sales and maturities of available-for-sale securities 1,325 4,970 6,990
Insurance proceeds 7 79 64
Change in restricted cash 24 (24) —
Other 102 36 —
Net cash used in investing activities (2,282) (2,212) (2,400)
See Notes to Consolidated Financial Statements