Duke Energy 2012 Annual Report Download - page 55
Download and view the complete annual report
Please find page 55 of the 2012 Duke Energy annual report below. You can navigate through the pages in the report by either clicking on the pages listed below, or by using the keyword search tool below to find specific information within the annual report.-
 1
1 -
2
-
3
-
4
-
5
-
6
-
7
-
8
-
9
-
10
-
11
-
12
-
13
-
14
-
15
-
16
-
17
-
18
-
19
-
20
-
21
-
22
-
23
-
24
-
25
-
26
-
27
-
28
-
29
-
30
-
31
-
32
-
33
-
34
-
35
-
36
-
37
-
38
-
39
-
40
-
41
-
42
-
43
-
44
-
 45
45 -
 46
46 -
 47
47 -
 48
48 -
 49
49 -
 50
50 -
 51
51 -
 52
52 -
 53
53 -
 54
54 -
 55
55 -
 56
56 -
 57
57 -
 58
58 -
 59
59 -
 60
60 -
 61
61 -
 62
62 -
 63
63 -
 64
64 -
 65
65 -
66
-
67
-
68
-
69
-
70
-
71
-
72
-
73
-
74
-
75
-
76
-
77
-
78
-
79
-
80
-
81
-
82
-
83
-
84
-
85
-
86
-
87
-
88
-
89
-
90
-
91
-
92
-
93
-
94
-
95
-
96
-
97
-
98
-
99
-
100
-
101
-
102
-
103
-
104
-
105
-
106
-
107
-
108
-
109
-
110
-
111
-
112
-
113
-
114
-
115
-
116
-
117
-
118
-
119
-
120
-
121
-
122
-
123
-
124
-
125
-
126
-
127
-
128
-
129
-
130
-
131
-
132
-
133
-
134
-
135
-
136
-
137
-
138
-
139
-
140
-
141
-
142
-
143
-
144
-
145
-
146
-
147
-
148
-
149
-
150
-
151
-
152
-
153
-
154
-
155
-
156
-
157
-
158
-
159
-
160
-
161
-
162
-
163
-
164
-
165
-
166
-
167
-
168
-
169
-
170
-
171
-
172
-
173
-
174
-
175
-
176
-
177
-
178
-
179
-
180
-
181
-
182
-
183
-
184
-
185
-
186
-
187
-
188
-
189
-
190
-
191
-
192
-
193
-
194
-
195
-
196
-
197
-
198
-
199
-
200
-
201
-
202
-
203
-
204
-
205
-
206
-
207
-
208
-
209
-
210
-
211
-
212
-
213
-
214
-
215
-
216
-
217
-
218
-
219
-
220
-
221
-
222
-
223
-
224
-
225
-
226
-
227
-
228
-
229
-
230
-
231
-
232
-
233
-
234
-
235
-
236
-
237
-
238
-
239
-
240
-
241
-
242
-
243
-
244
-
245
-
246
-
247
-
248
-
249
-
250
-
251
-
252
-
253
-
254
-
255
-
256
-
257
-
258
-
259
-
260
-
261
-
262
-
263
-
264
-
265
-
266
-
267
-
268
-
269
-
270
-
271
-
272
-
273
-
274
-
275
-
276
-
277
-
278
-
279
-
280
-
281
-
282
-
283
-
284
-
285
-
286
-
287
-
288
-
289
-
290
-
291
-
292
-
293
-
294
-
295
-
296
-
297
-
298
-
299
-
300
-
301
-
302
-
303
-
304
-
305
-
306
-
307
-
308
 |
 |

35
PART II
certain charges and credits, which management believes will not be recurring
on a regular basis, although it is reasonably possible such charges and credits
could recur. Mark-to-market adjustments refl ect the mark-to-market impact
of derivative contracts, which is recognized in GAAP earnings immediately as
such derivative contracts do not qualify for hedge accounting or regulatory
accounting treatment, used in Duke Energy’s hedging of a portion of economic
value of its generation assets in the Commercial Power segment. The economic
value of the generation assets is subject to fl uctuations in fair value due to
market price volatility of the input and output commodities (e.g., coal, power)
and, as such, the economic hedging involves both purchases and sales of those
input and output commodities related to the generation assets. Because the
operations of the generation assets are accounted for under the accrual method,
management believes that excluding the impact of mark-to-market changes
of the economic hedge contracts from operating earnings until settlement
better matches the fi nancial impacts of the hedge contract with the portion of
economic value of the underlying hedged asset. Management believes that the
presentation of adjusted earnings and adjusted diluted EPS provides useful
information to investors, as it provides them an additional relevant comparison
of Duke Energy’s performance across periods. Management uses this non-GAAP
fi nancial measure for planning and forecasting and for reporting results to the
Board of Directors, employees, shareholders, analysts and investors concerning
Duke Energy’s fi nancial performance. The most directly comparable GAAP
measure for Adjusted earnings and Adjusted diluted EPS is Net Income and
Diluted EPS attributable to Duke Energy common shareholders, which includes
the dollar and per share impact of special items, the mark-to-market impacts
of economic hedges in the Commercial Power segment and discontinued
operations.
OVERVIEW
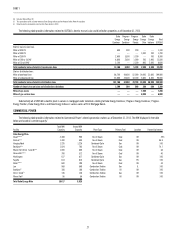
The following table reconciles Adjusted earnings to Net income attributable to Duke Energy and Adjusted diluted EPS to Diluted EPS attributable to Duke Energy
(amounts are net of tax):
Years Ended December 31,
2012 2011 2010
(in millions, except per share amounts) Amount
Per
diluted
share Amount
Per
diluted
share Amount
Per
diluted
share
Adjusted earnings $2,483 $ 4.32 $1,943 $ 4.38 $1,882 $ 4.29
Edwardsport charges (402) (0.70) (135) (0.30) — —
Costs to achieve mergers and acquisitions (397) (0.70) (51) (0.12) (17) (0.04)
Economic hedges (mark-to-market) (6) (0.01) (1) (0.01) 21 0.04
Democratic National Convention host committee support (6) (0.01) —— ——
Employee severance and offi ce consolidation 60 0.11 — — (105) (0.24)
Emission allowance impairment ——(51) (0.12) — —
Goodwill and other asset impairments ——— — (602) (1.37)
Litigation reserves ——— — (16) (0.04)
Asset sales ——— — 154 0.35
Income from discontinued operations 36 0.06 1 — 3 0.01
Net income attributable to Duke Energy $1,768 $ 3.07 $1,706 $ 3.83 $1,320 $ 3.00
The variance in adjusted earnings for the year ended December 31, 2012,
compared to the year ended December 31, 2011, was primarily due to:
• The inclusion of Progress Energy results beginning in July 2012; and
• Increased retail pricing and riders primarily resulting from the
implementation of revised rates in North Carolina and South Carolina.
Partially offset by
• Unfavorable weather in 2012 compared to 2011;
• Higher depreciation and amortization expense;
• Lower nonregulated Midwest coal generation results; and
• Incremental shares issued to complete the Progress Energy merger
(impacts per share diluted amounts only).
The variance in adjusted earnings for the year ended December 31, 2011,
compared to the year ended December 31, 2010, was primarily due to:
• Increased earnings associated with major construction projects at
USFE&G;
• Effect of 2010 Duke Energy Foundation funding;
• Increased results in Brazil due to higher average contract prices;
• Increased earnings from National Methanol Company (NMC);
• Lower corporate governance costs;
• Increased results in Peru due to additional capacity revenues and an
arbitration award; and
• Increased results in Central America due to higher average prices and
volumes.
Partially offset by
• Less favorable weather in 2011 compared to 2010 at USFE&G;
• Increased operation and maintenance costs at USFE&G; and
• Lower volumes as a result of customer switching in Ohio, net of
retention by Duke Energy Retail Sales, LLC (Duke Energy Retail) at
Commercial Power.
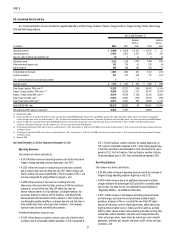
Segment Results
In 2012, management began evaluating segment performance based
on segment income. Segment income is defi ned as income from continuing
operations net of income attributable to noncontrolling interests. Segment
income, as discussed below, includes intercompany revenues and expenses
that are eliminated in the Consolidated Financial Statements. In conjunction