Duke Energy 2012 Annual Report Download - page 215
Download and view the complete annual report
Please find page 215 of the 2012 Duke Energy annual report below. You can navigate through the pages in the report by either clicking on the pages listed below, or by using the keyword search tool below to find specific information within the annual report.-
 1
1 -
2
-
3
-
4
-
5
-
6
-
7
-
8
-
9
-
10
-
11
-
12
-
13
-
14
-
15
-
16
-
17
-
18
-
19
-
20
-
21
-
22
-
23
-
24
-
25
-
26
-
27
-
28
-
29
-
30
-
31
-
32
-
33
-
34
-
35
-
36
-
37
-
38
-
39
-
40
-
41
-
42
-
43
-
44
-
45
-
46
-
47
-
48
-
49
-
50
-
51
-
52
-
53
-
54
-
55
-
56
-
57
-
58
-
59
-
60
-
61
-
62
-
63
-
64
-
65
-
66
-
67
-
68
-
69
-
70
-
71
-
72
-
73
-
74
-
75
-
76
-
77
-
78
-
79
-
80
-
81
-
82
-
83
-
84
-
85
-
86
-
87
-
88
-
89
-
90
-
91
-
92
-
93
-
94
-
95
-
96
-
97
-
98
-
99
-
100
-
101
-
102
-
103
-
104
-
105
-
106
-
107
-
108
-
109
-
110
-
111
-
112
-
113
-
114
-
115
-
116
-
117
-
118
-
119
-
120
-
121
-
122
-
123
-
124
-
125
-
126
-
127
-
128
-
129
-
130
-
131
-
132
-
133
-
134
-
135
-
136
-
137
-
138
-
139
-
140
-
141
-
142
-
143
-
144
-
145
-
146
-
147
-
148
-
149
-
150
-
151
-
152
-
153
-
154
-
155
-
156
-
157
-
158
-
159
-
160
-
161
-
162
-
163
-
164
-
165
-
166
-
167
-
168
-
169
-
170
-
171
-
172
-
173
-
174
-
175
-
176
-
177
-
178
-
179
-
180
-
181
-
182
-
183
-
184
-
185
-
186
-
187
-
188
-
189
-
190
-
191
-
192
-
193
-
194
-
195
-
196
-
197
-
198
-
199
-
200
-
201
-
202
-
203
-
204
-
 205
205 -
 206
206 -
 207
207 -
 208
208 -
 209
209 -
 210
210 -
 211
211 -
 212
212 -
 213
213 -
 214
214 -
 215
215 -
 216
216 -
 217
217 -
 218
218 -
 219
219 -
 220
220 -
 221
221 -
 222
222 -
 223
223 -
 224
224 -
 225
225 -
226
-
227
-
228
-
229
-
230
-
231
-
232
-
233
-
234
-
235
-
236
-
237
-
238
-
239
-
240
-
241
-
242
-
243
-
244
-
245
-
246
-
247
-
248
-
249
-
250
-
251
-
252
-
253
-
254
-
255
-
256
-
257
-
258
-
259
-
260
-
261
-
262
-
263
-
264
-
265
-
266
-
267
-
268
-
269
-
270
-
271
-
272
-
273
-
274
-
275
-
276
-
277
-
278
-
279
-
280
-
281
-
282
-
283
-
284
-
285
-
286
-
287
-
288
-
289
-
290
-
291
-
292
-
293
-
294
-
295
-
296
-
297
-
298
-
299
-
300
-
301
-
302
-
303
-
304
-
305
-
306
-
307
-
308
 |
 |

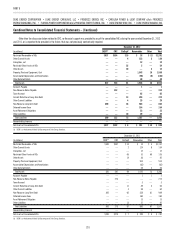
195
PART II
DUKE ENERGY CORPORATION • DUKE ENERGY CAROLINAS, LLC • PROGRESS ENERGY, INC. • CAROLINA POWER & LIGHT COMPANY d/b/a PROGRESS
ENERGY CAROLINAS, INC. • FLORIDA POWER CORPORATION d/b/a PROGRESS ENERY FLORIDA, INC. • DUKE ENERGY OHIO, INC. • DUKE ENERGY INDIANA, INC.
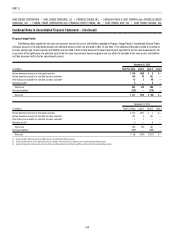
Combined Notes to Consolidated Financial Statements – (Continued)
December 31, 2012 December 31, 2011
(in millions) Fair Value
Unrealized
Loss
Position
>12 months
Unrealized
Loss
Position
<12 months Fair Value
Unrealized
Loss
Position
>12 months
Unrealized
Loss
Position
<12 months
NDTF
Equity securities $155 $ 4 $ 15 $111 $ 4 $ 12
Corporate debt securities 42 — 1 5711
Municipal bonds 29 1 — ———
U.S. government bonds 135 — 1 8——
Other debt securities 38 — 1 11313
Total NDTF $399 $ 5 $ 18 $289 $ 6 $ 16
Other Investments
Equity securities $4 $— $— $12 $ 1 $ 1
Corporate debt securities 7——201 1 —
Municipal bonds 18 1 — 3——
U.S. government bonds 6—————
Other debt securities 21——8——
Auction rate securities 29 6 — 71 17 —
Total Other Investments $85 $7 $— $295 $ 19 $ 1
Total Investments $484 $ 12 $ 18 $584 $ 25 $ 17
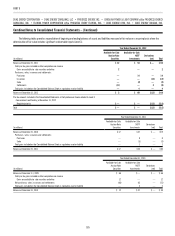
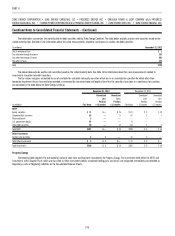
Duke Energy Carolinas
The following table presents the estimated fair value of short-term and long-term investments for Duke Energy Carolinas. For investments held within the NDTF,
unrealized holding gains and losses are recognized immediately and recorded as Regulatory assets or Regulatory liabilities on the Consolidated Balance Sheets.
December 31, 2012 December 31, 2011
(in millions)
Gross
Unrealized
Holding
Gains
Gross
Unrealized
Holding
Losses
Estimated
Fair
Value
Gross
Unrealized
Holding
Gains
Gross
Unrealized
Holding
Losses
Estimated
Fair
Value
NDTF
Cash and cash equivalents $— $— $ 40 $— $— $ 63
Equity securities 600 5 1,592 443 16 1,337
Corporate debt securities 11 1 250 8 2 205
Municipal bonds 2—40 2—51
U.S. government bonds 10 — 304 16 — 306
Other debt securities 9 2 135 4498
Total NDTF $632 $ 8 $ 2,361 $473 $ 22 $2,060
Other Investments
Auction rate securities —13—312
Total Other Investments(a) $— $ 1 $ 3 $— $ 3 $ 12
Total Investments $632 $ 9 $2,364 $473 $ 25 $2,072
(a) These amounts are recorded in Other within Investments and Other Assets on the Consolidated Balance Sheets.